Really? Do I need to change GW Shield to have holes to fix this display that I love so much
PS : Take care that 2 SPI devices on same SPI bus with 2 different process may cause trouble (both process accessing SPI bus at the same time). I do not know if Debian has a kind of build in semaphore to prevent this to happen?
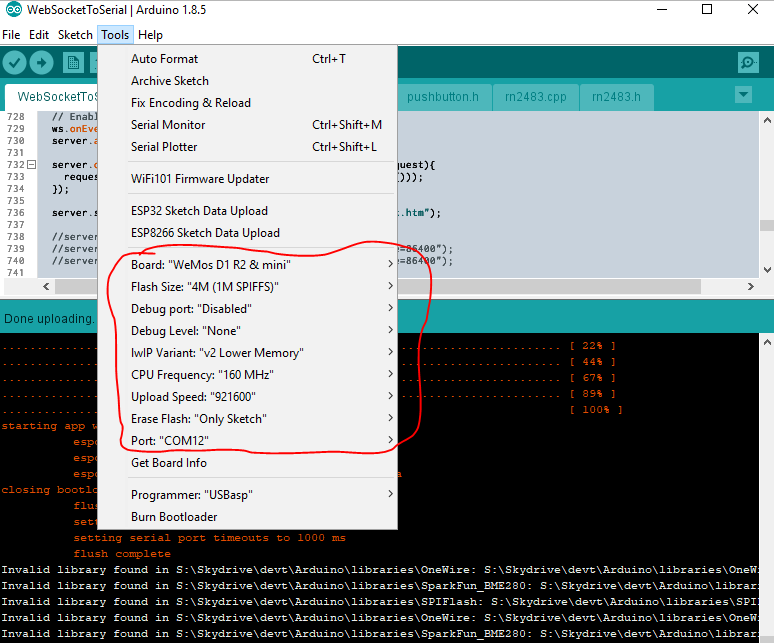
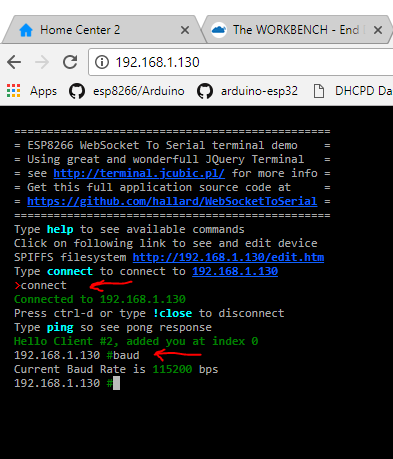
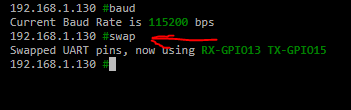
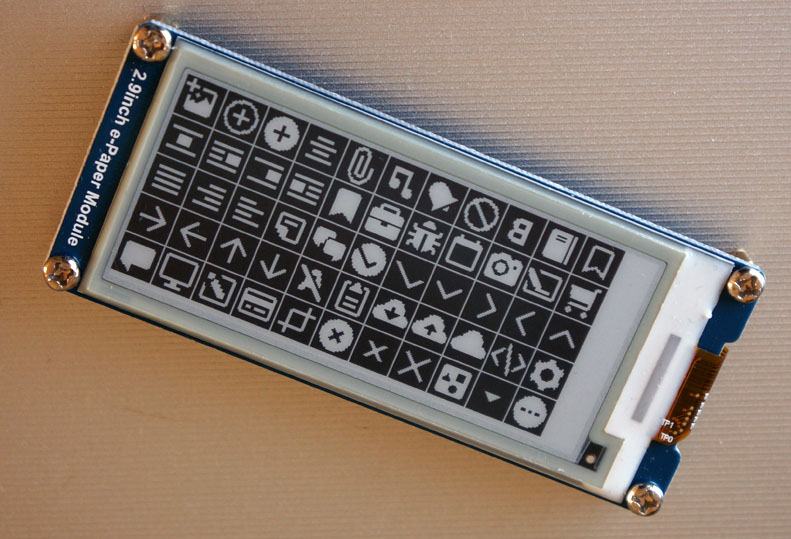
create an (esp) webserver that transmits a webpage with the TTN’s gateway UART debug data, so you can check on a browser (phone/laptop ) the uart output messages wireless.
just a little tool that you plugin the TTN gateway and it works.
but I realize that the TTN gateway power supply is possibly not strong enough ?
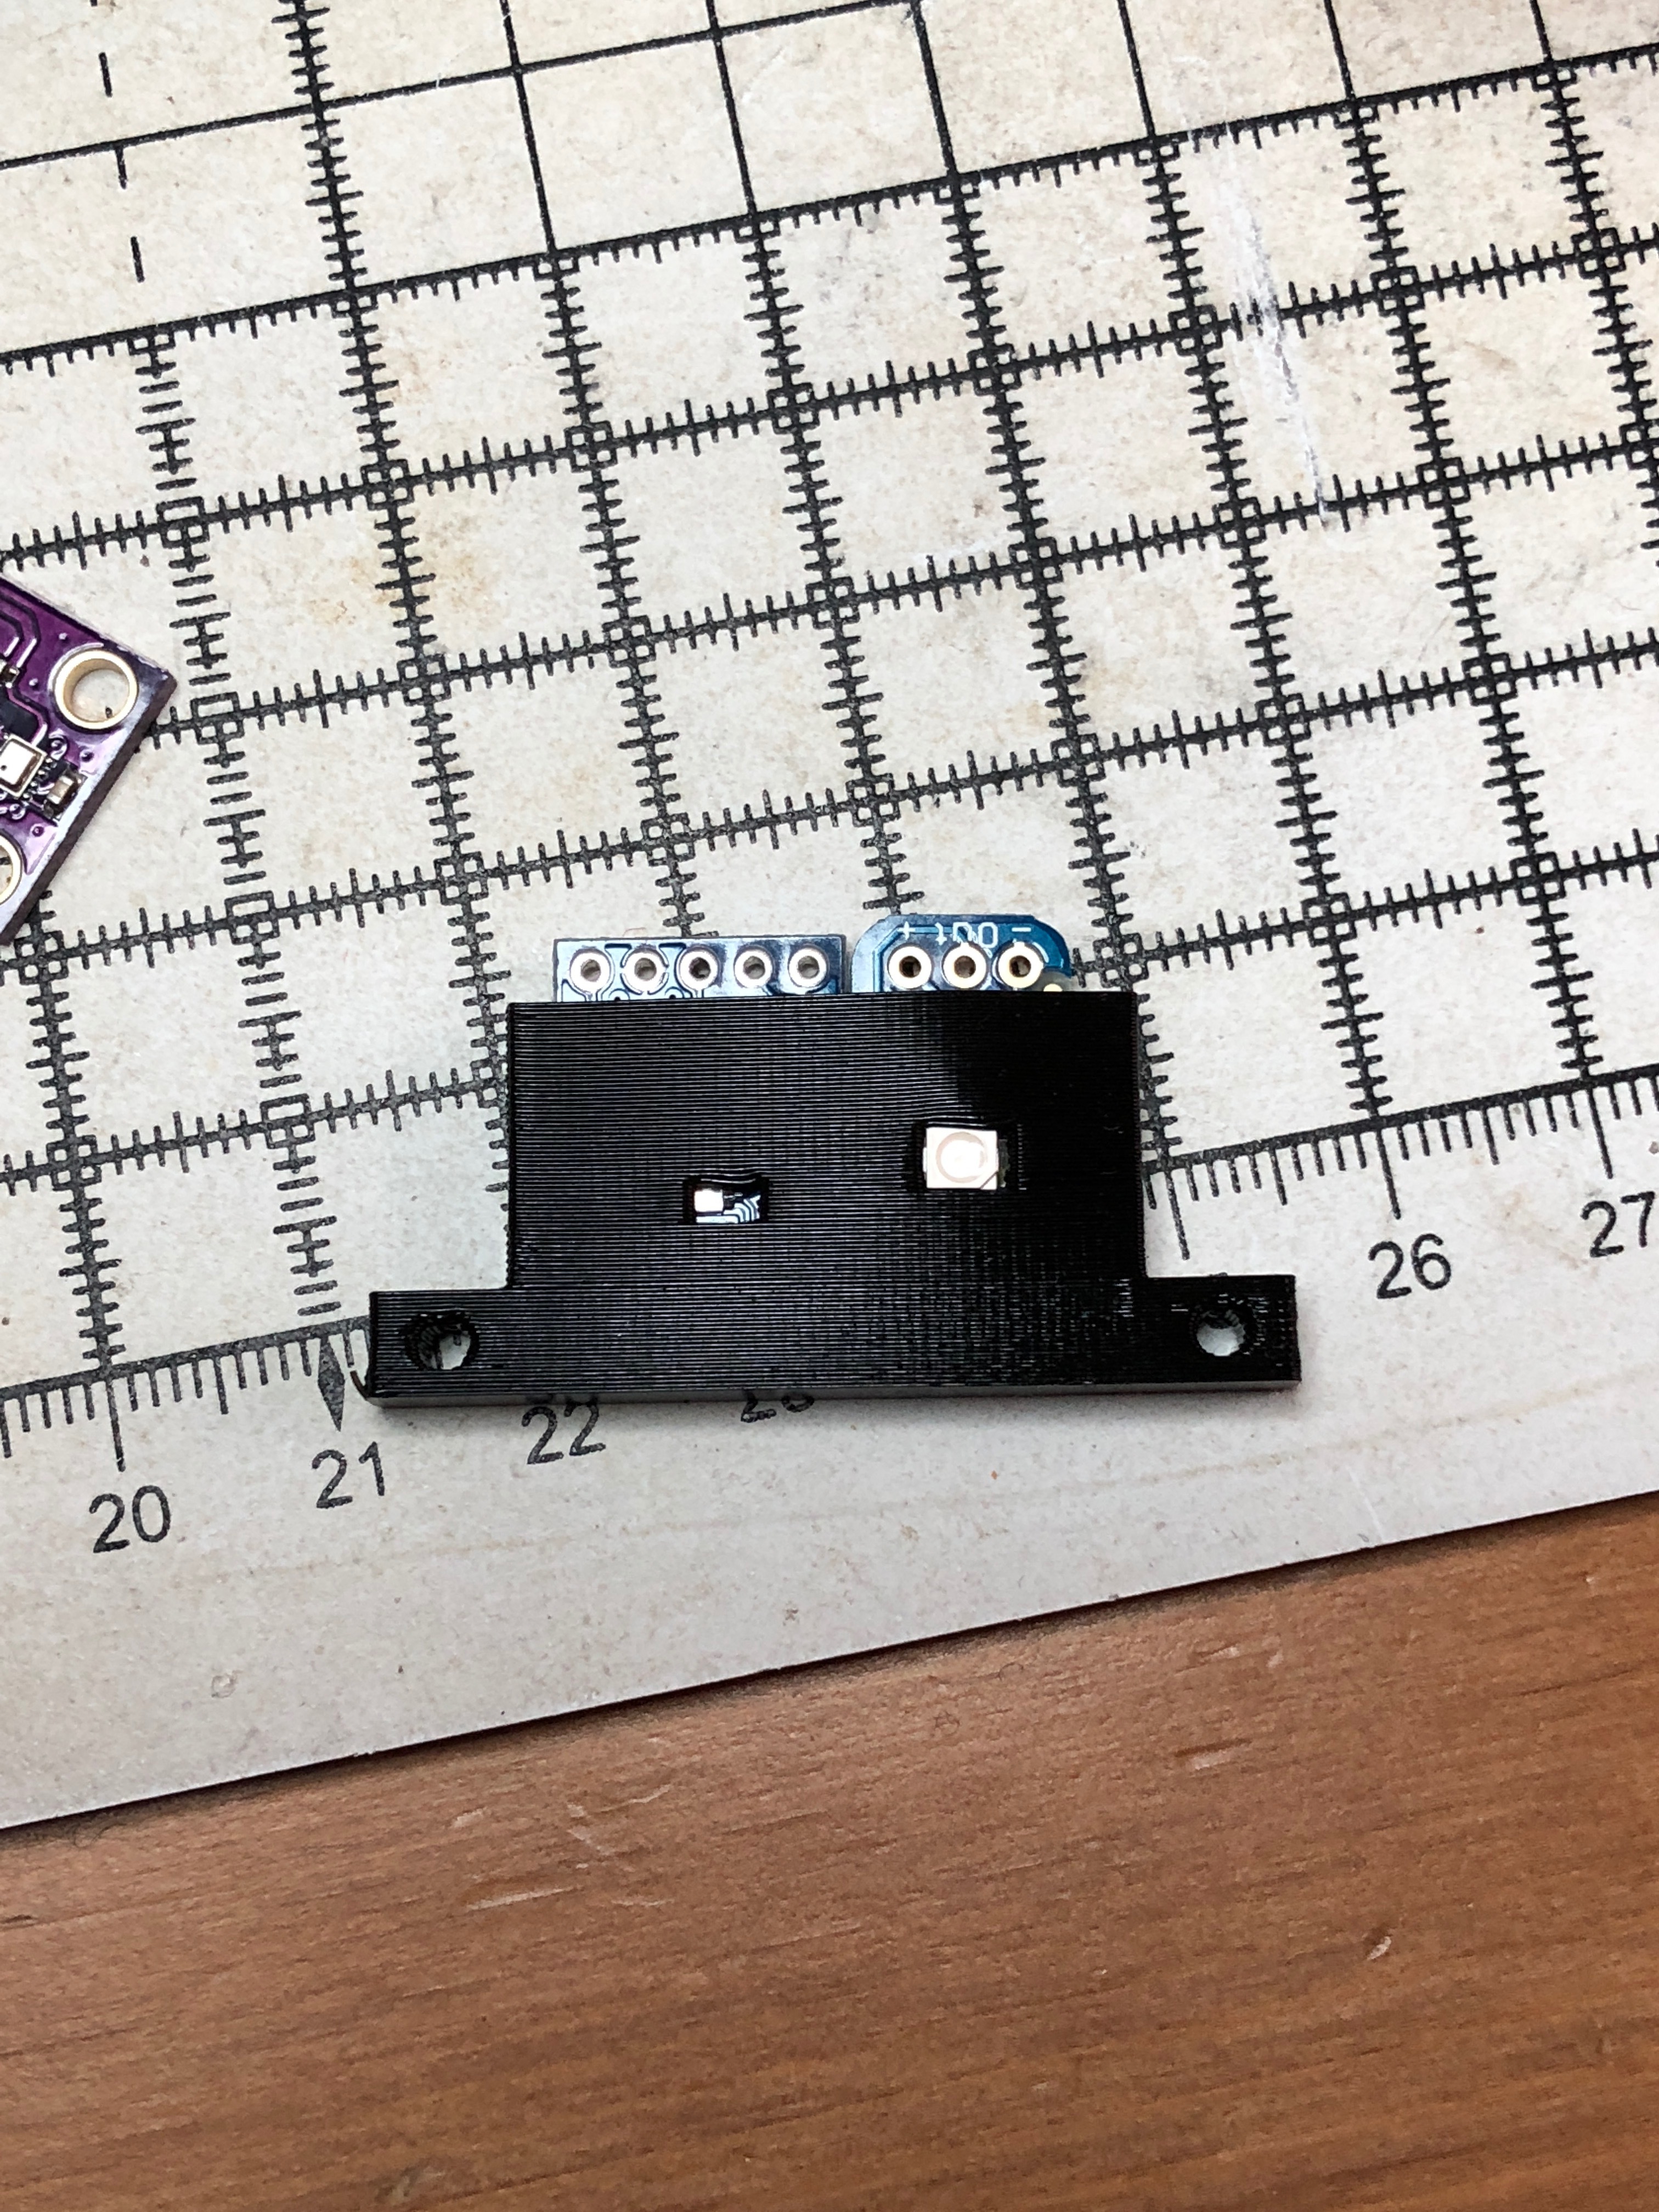
Wondering how to get accurate UV and lux measurements from a sensor, while still protecting the electronics A piece of glass would be the obvious thought, but glass is pretty good at blocking UV.
Started thinking about using flexible TPU to print a “snug” case for the sensors themselves - needs some alignment still but I can see how you might want to assemble most of the case internals like this. (I don’t think it’ll provide much environmental protection tho).
@Amedee the work you do to split up the docker in resin.io looks really great! Could you describe a little bit how to setup prometheus, collectd and how to get the status data? I am running a typical RasPi3 + IMST IC880a Gateway and your last development for the fan control is for the original ttn gw, or? I got a VM with Node-RED/Grafana/InfluxDB and would love to get the status data visualised by trying your build on my gateway - if you can help connect it, or tell me how to reach the status data your build provides!
It is still work in progress, I try to do some cleanup this Easter week-end, but it already runs on my 2 gateways – one with resin.io, the other with standard raspbian and docker.
My objective is to maintain something that can run seamlessly in both resin.io or docker – some people being reluctant to move to resin.io (either because they don’t want to involve a cloud 3rd party, or just because they run other things on their Pi).
My current monitoring setup is Collectd/InfluxDB/Grafana – I am not using Prometheus for now; Prometheus is in the setup because it was in JPM’s repo, but if you look in my fork I also have a docker-compose-collectd.yml file.
So basically:
docker-compose.yml is for a Prometheus Exporter / Prometheus / Grafana stack (exporter code is the one from Jac)
docker-compose-collectd.yml is for a Collectd / InfluxDB (or Graphite if you prefer) / Grafana stack
Both are reporting the same info in term of gateway statistics, so it is a matter of taste.
(I also have a nginx/Node-Red/InfluxDB/Grafana docker setup for the ‘client’ side, but I need to push that one to GitHub…)
Regarding the fan control is only for @dbrgn 's RPi3/IC880a backplane (It can probably easily re-used on other hardware, but this is the only one I have )
So I’ve built this distro and downloaded it to my dev gateway… I should just be able to point Grafana to either the resin.io public device URL, or my local IP?
There is no Prometheus server running on the node, only the “exporters” so you need “something else” between Grafana and the node (Prometheus or InfluxDB depending on your what you choose)
But you could use the public IP, I use the local IP to get a direct connection.
While we could run Prometheus/InfluxDB on the node, I don’t think it is a great idea, because the SD-cards do not like to much writes…
And I also prefer to consolidate the data of all my (2) nodes in one place.


 A piece of glass would be the obvious thought, but glass is pretty good at blocking UV.