Troubleshooting E5 Dev board join connection issues

EDIT/TLDR: The Milesight UG63 v2 gateway has problems with syncing time and can’t schedule down packets correctly. It also seems to not even allow firmware updates. I’m returning it.

I’m new to LoRaWAN and got some hardware set up, but having trouble joining the node to my app after a whole day of debugging/searching. I’m following Wio-E5 Development Kit | Seeed Studio Wiki

I’ve set up a public gateway and configured it on TTN. I’m in Australia.

I’m talking to the E5 dev board via AT commands. I’ve created a device in a TTN application, manually configured it by entering the DEV and JOIN (APP) EUI’s from the device. I generated an app key on the TTN console for that device and set it on the device via AT+KEY=APPKEY,“key goes here”.

Also set up the device in the TTN console to be AU915 FSB 2, LoRaWAN v1.0.2, RP v1.0.2B.

I also ran AT+DR=AU915 and AT+CH=NUM,8-15. I’m not sure of the channel numbers based on all the searching I’ve done, it seems that channels 8-15 is FSB 2? I did try 0-7 without any up messages coming into TTN console at all.

I’ve also run AT+MODE=LWOTAA.

When I try join using AT+JOIN, it says this:
AT+JOIN
+INFO: Input timeout
+JOIN: Start
+JOIN: NORMAL
+JOIN: Join failed
+JOIN: Done

However I do see messages in the GW and in TTN console GW logs and App logs going “up”. TTN app replies and sends “Forward join-accept message” to the GW (in the TTN GW activity) “Send downlink message Tx Power 30 Data rate SF12BW500”.

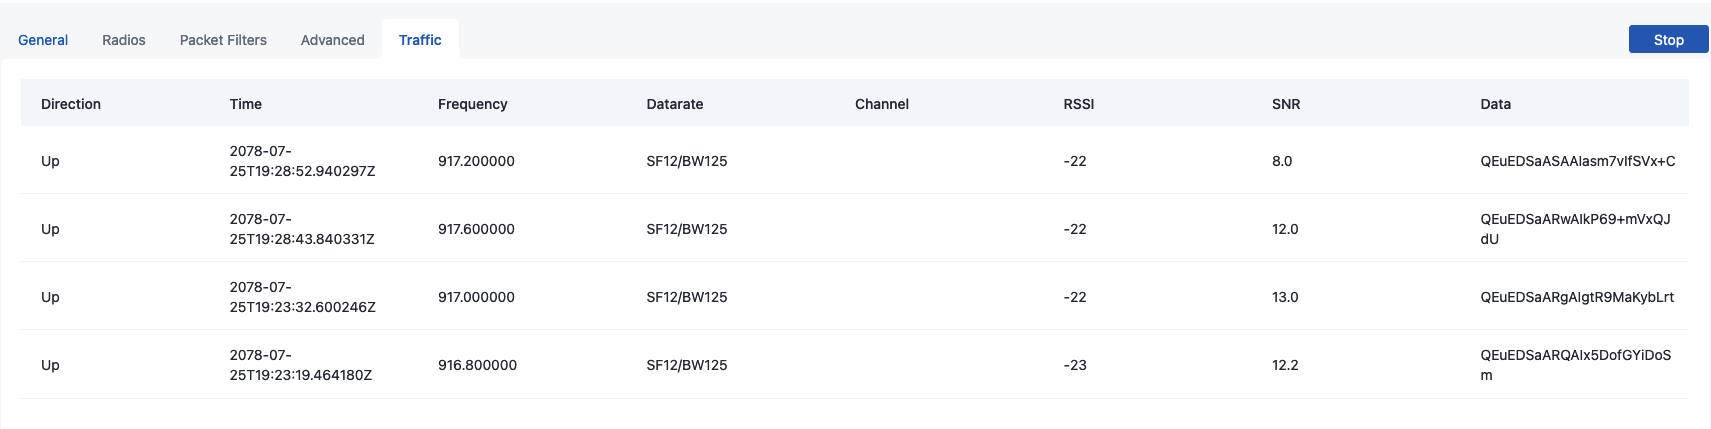
The GW itself has a simple radio traffic log that shows packets. So far I’ve only seen “up” packets, including mine and some rare random packets. There’s not much activity in my area so it’s easy to keep track.

I have not seen any “down” messages on the GW itself so I suspect, for some reason, TTN and my GW has a communication problem. (Or maybe the GW doesn’t log down packets)

My GW is a UG63v2 and I’ve left the radio settings as default, which was preconfigured with AU915. I also set up the GW Basics Station via CUPS which I understand sets up LNS for me (however I see no LNS URI, which might be a problem).

Can I get some suggestions to debug this further? Cheers!

I now suspect it is a time sync issue. NTP sync is on in the settings (on by default).

The status dashboard screen shows the correct time, but the “packet traffic” page shows the dates are totally off:

A date example is 2078-07-25T19:28:52.940297Z.

Relevent log entries:

2024-04-13 14:50:53 station_log: 0000-00-00 00:00:00.000 [SYN:VERB] Time sync rejected: quality=294 threshold=
284
2024-04-13 14:50:53 station_log: 0000-00-00 00:00:00.000 [S2E:VERB] ::1 diid=49664 [ant#0] - class A has no more alternate TX time

The logs are filled with these time errors:

2024-04-13 07:11:29 pkt_http:  DBUG pkt_tarffic_start_index:0, pkt_tarffic_end_index:4
2024-04-13 07:11:29 station_log: 0000-00-00 00:00:00.000 [SYN:WARN] Repeated excessive clock drifts between MCU/SX130X#0 (1761 retries): 214748364.7ppm (threshold 100.0ppm)
2024-04-13 07:11:29 station_log: 0000-00-00 00:00:00.000 [S2E:VERB] ::1 diid=50241 [ant#0] - class A has no more alternate TX time
2024-04-13 07:11:31 http:  DBUG Recv header: */*
2024-04-13 07:11:31 http:  DBUG Get token success, ret:0, cookie_len:33
2024-04-13 07:11:31 http:  DBUG Token check success, index: 0, update expire_time
2024-04-13 07:11:31 pkt_http:  DBUG pkt_tarffic_start_index:0, pkt_tarffic_end_index:4
2024-04-13 07:11:31 http:  DBUG HTTP event! 3
2024-04-13 07:11:31 task_mg:  INFO Not found schedule name:http_req_timer
2024-04-13 07:11:31 task_mg:  INFO Schedule http_req_timer added and started successfully
2024-04-13 07:11:31 http:  DBUG HTTP event! 6
2024-04-13 07:11:31 task_mg:  INFO Schedule http_req_timer del done,ret: 0
2024-04-13 07:11:32 station_log: 0000-00-00 00:00:00.000 [SYN:WARN] Repeated excessive clock drifts between MCU/SX130X#0 (1764 retries): 214748364.7ppm (threshold 100.0ppm)
2024-04-13 07:11:35 station_log: 0000-00-00 00:00:00.000 [SYN:WARN] Repeated excessive clock drifts between MCU/SX130X#0 (1767 retries): 214748364.7ppm (threshold 100.0ppm)

This is suggesting to me that it received a potential packet to be broadcast, but it thinks that it did not make it in time, because the time is actually very wrong and can’t make the class A receive window (by about 54 years!)

I’ll email Milesight support to see what they think, and probably will have to return the GW for something less buggy.

What d you see in the gateway console?

How far is the node form the gateway?

What is the RSSI?

Hi Johan,

Thanks for taking the time!

This is the interaction on the gateway when on join:

The node is a meter away, RSSI -20 to -50.

I forgot to mention I monitor the spectrum with an SDR, seeing the up chirps, but nothing in the down frequencies:

image

The gateway is not sending anything down on RF that I can see.

Way too close…search forum for seperation guidance! Remember this is a Long Range technology and right now your GW & Device ARE SHOUTING AT EACH OTHER! Especially when running in a region where 25-30dbm Tx power allowed vs say 14-16 here in EMEA

-50dbm “should” be ok but best signal range when doing device debug is ~ -60 → -95dbm

Hi Jeff,

Thanks for the tip on separation. Will check it out.

I do realise they’re yelling at each other, this is just a test setup to get it working. The messages from the node are 100% making it to the network server.

I did separate them some more (-70dbm) to see if there’s any difference in the problem, without any change. Gateway still is not broadcasting anything.

The hardware isn’t sentient enough to realise that it’s “just a test setup” - you have to get a 5-10m separation with brick wall between them.

As the TTN console shows the Join Accept being sent and the logs from the gateway look like something rather bizarre is going on with running out of Tx time and some such, I’d look to reflash the gateway’s firmware to make sure you are operating from a known good version.

Thanks, I get it. :slight_smile: Right now this isn’t the cause of the problem, so I would rather stay on topic.

Interestingly I did try to update the firmware but the software on the gateway didn’t allow it. It told me the firmware was too big. Quite a buggy system!

I did do a factory reset thanks to your suggestion, reconfigured basics server, and down messages are now coming through!

My suspicion was correct about the time sync problem. I see the “traffic” page on the gateway now showing correct timestamps, and however logs from the gateway are showing time sync rejections again and looks like the time is already drifting.

Unfortunately if the time goes out of sync again with whatever systems are involved (as shown in the logs hint above), this gateway would be totally useless to run continously.

Just to reiterate, NTP is set up (by deftaut) and I did try different, more local NTP servers. This is a bug in the gateway software.

I’ll be returning this Milesight for something else, maybe open source based.

How is you gateway connected to the internet? Fiber, cell or?

I have a good connection, 1000/400 fiber.

Erm, OK, you ask for advice, we provide it, in this case based on the numerous times people have issues with gateways due to device & gateway being too close, like several times per month. Mostly problems are a single issue but it’s not uncommon for more than one thing to be going on.

You may want to try an older version of the firmware to see how your fair with that, but @Jeff-UK is better placed to comment on gateways.

Thanks for the help everyone, I got another gateway and it all works perfectly. It was most likely a time sync bug in that Milesight gateway. Their support was not helpful at all.

Not an unusual observation - many manufacturers don’t live at the coal face and they rarely eat their own dog food - ie, they aren’t running one at home or in their local university etc.

What could they do to improve?