I receive around 3000 messages per hour on one of my gateways.
The TTN Console Gateway/Traffic webpage truncates the log to about 100 messages.
In practice this means that after around 2 minutes and 15 seconds the messages are truncated from the log and go out of scope. Even when filtering on device address the filtered messages go out of scope after 2 minutes and 15 seconds (only works on non-truncated messages).
In cases with substantial traffic truncating the log after 100 messages will render the traffic log useless for most purposes. Unable to even correlate 2 subsequent messages from the same device address.
A limitation of 100 messages in the traffic log might be sufficient in a controlled lab environment but it is unusable in a real live environment with some decent traffic.
This will not be changed for v2. In our v3 stack we expose events over an API endpoint, so you will be able to subscribe to events for your gateway and store as many as you want on your end. We’re still looking into how we can display these events in the v3 console. You can follow issue 28 on Github if you’re interested.
Thanks, but that is not going to help me at all for the next year or so.
It was not an issue until recently when some 1000 nodes were dumped in my neighbourhood.
Now while TTN actually gets being used in real applications I am suddenly being handicapped by the TTN Console for the traffic that my gateway contributes to the Things Network!
Having to wait for 6 to 12 months on wide rollout of V3 on the public Things Network is not an option here. Some temporary workaround should be provided instead.
Not being able to see what is going on locally is indeed a real frustration when doing development and testing. You might consider modifying your gateway’s software to send the data somewhere else for your monitoring, as well as to TTN servers (this is, after all data transcribed from public airwaves, so still retaining any user encryption - you would only be able to fully interpret the fraction that is yours)
At a crude level it doesn’t take much change to get a Semtech packet forwarder to log to packets to syslog, and you can recover them from there. At a more sophisticated one a different stack I’ve been working with lately uses an MQTT broker as the central data interchange, which means that it’s possible to subscribe to both raw and application data with custom monitoring tools tuned to look into certain issues of interest.
sorry to dig up an old thread, but is it possible to subscribe to these events on the public ttn consoles or do we need to be running our own instance?
I found documentation for ttn-lw-cli but wonder if this can be used on the public instance and if so is there documentation on how to do this and where to get ttn-lw-cli ?
As described above this will only be supported in The Things Network Stack V3.
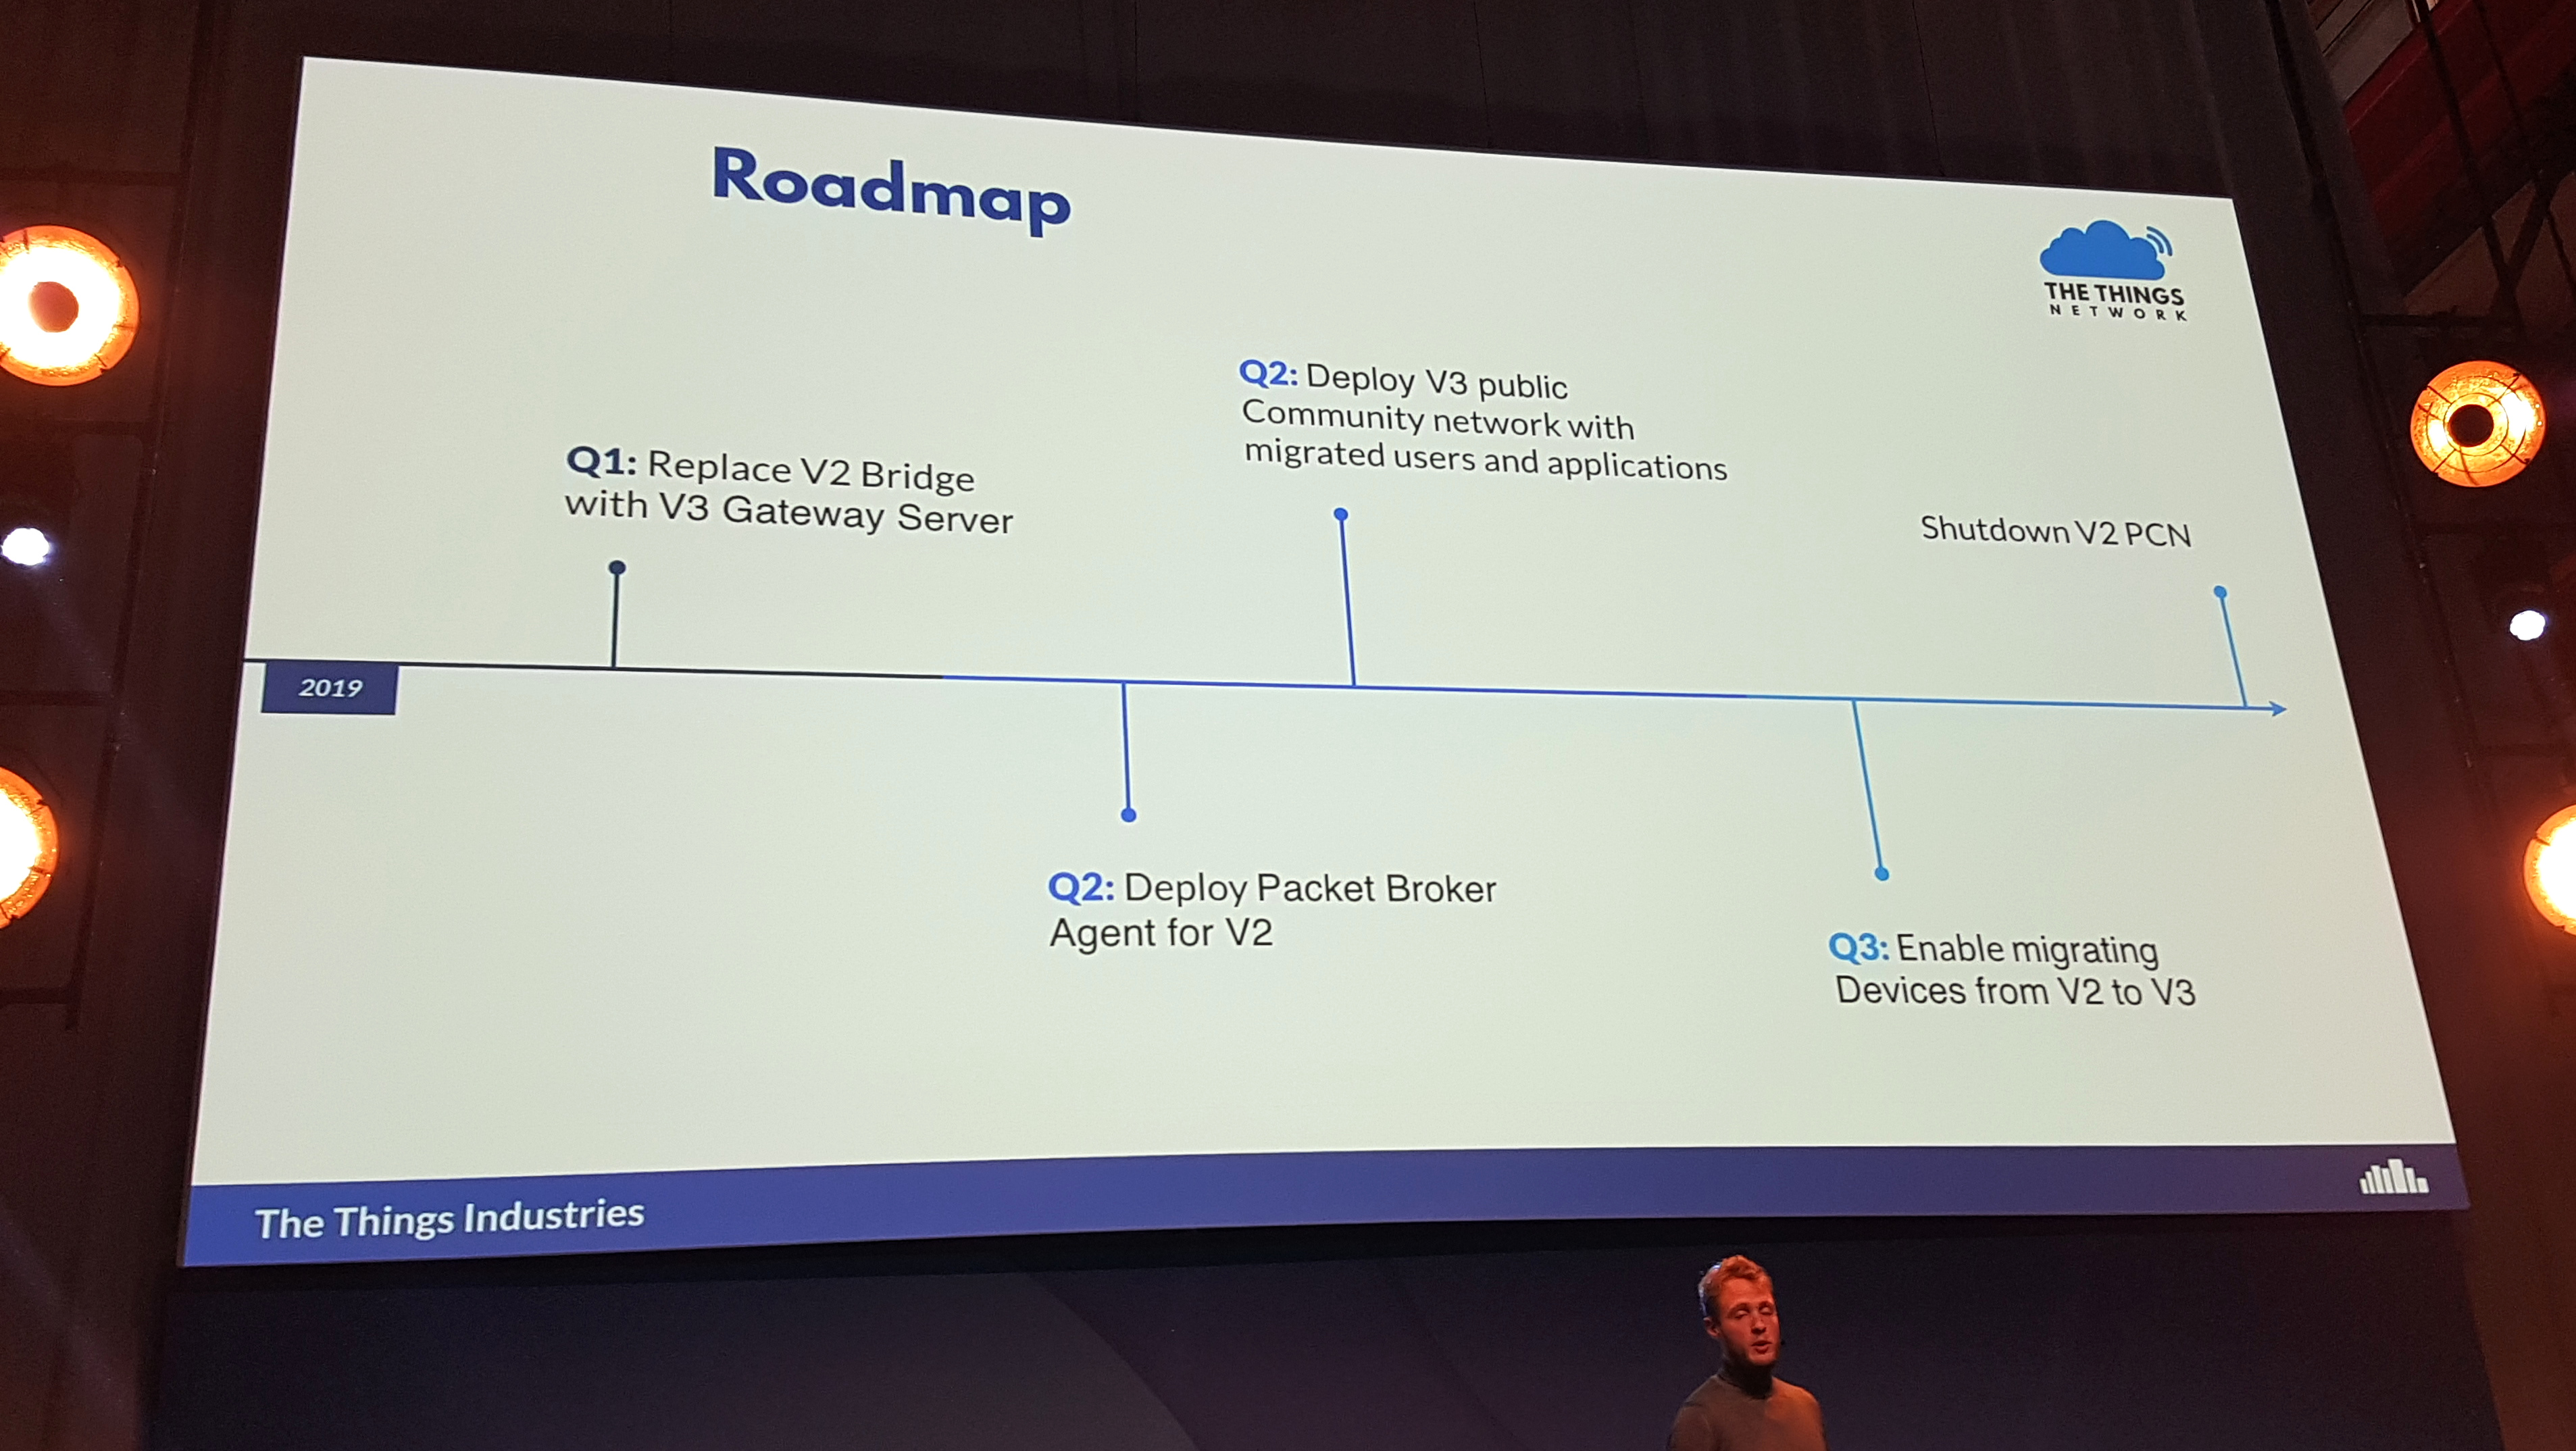
The public community network will be migrated to V3 this year, which will happen in several phases. Completion of migration to V3 is expected somewhere in 2020 Q3: