Hello,
I’m building a platform (TTNmon) for storing and visualizing the link quality between a node and a TTN gateway. The goal is to collect information about the fluctuation of parameters like SNR or RSSI. This way I want to find out more about environmental influences on LoRa communication.
The data is collected using the TTN HTTP Integration. It is stored in a database and available through an API and thereby by a web frontend. Furthermore I’m working on publishing database dumps to offer all data for own research purposes.
As a member of the TTN Community in Aachen I have currently only a few devices connected to my platform. These devices are mostly near to gateways so the significance of the collected data is low. However I want to give you an example of the data visualization. By clicking on the gateway you will get more information about the connection between the device and the specific gateway.
If you want to support my project please consider to register your node on my platform. You find the full instructions on https://ttnmon.meis.space/console/#. There are also details about which data is stored and what is public.
Please note that the platform is currently under development. I expect that there will be problems (under some circumstances). If you experience problems it would be great if you could inform me.
The project is open source and available on GitHub (Frontend, Backend). If you have any question please feel free to open an issue on GitHub or reply to this thread.
Sounds interesting! I have here a node for similar purposes that I have added to your system.
This node has specific behaviour for propagation observation. It is fixed to SF7 without ADR and Linkcheck at an interval of 5 minutes. Every 60 minutes it sends a transmission at SF12.
Ok, I have added some more nodes to the system and I observed some curious behaviour.
Two nodes using Microchip RN2483 ware stuck on SF12. After a reset of the nodes ADR started working again.
One node using LMIC is stuck on SF12 too. I will have to reset that one to see how behaviour will be than.
You can very nicely see that the RN2483 is using pseudo random channel selection while LMIC is sequentially stepping trough all channels.
Preliminary conclusion: Your tool is a welcome asset in learning about LoRaWAN, understanding behaviour of various stacks and implementations and a good aid with optimizing behaviour.
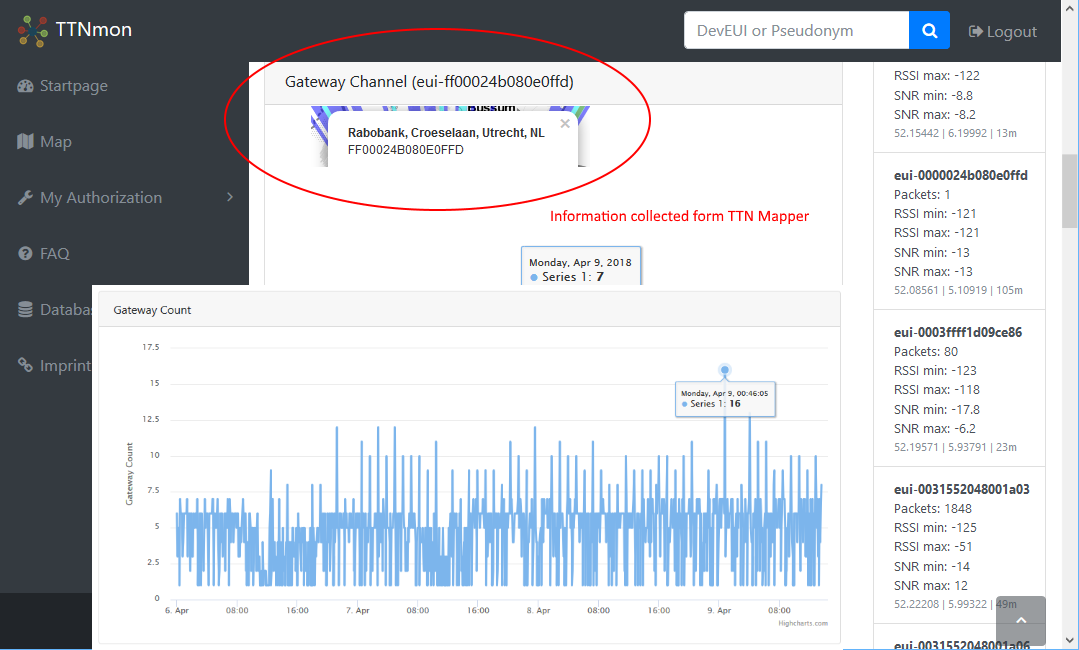
One suggestion: Is it possible to add a graph of the number of gateways over time that receive the node?
Thanks for adding some nodes. Having a graph for the number of gateways sounds great. I just implemented the graph and added it below the other graphs.
There is only access to devices required. This is used to verify that the webhook was actually called by TTN. Otherwise anybody could register DevEUIs he doesn’t own. After the first message, your device is registered to the Auth Token. If you don’t want to add more devices, you could then also remove access to devices.
…but TTN would not pass any messages then, as an access key would only grant access to data of nodes one really owns? Or maybe that’s related to using the HTTP Integration rather than MQTT?
It is because of the HTTP Integration. As the webhook needs to be public, anybody could register devices without acutally owning them. Thus I thought it might be better to check the device.
As far as I understand MQTT I would need a MQTT connection for each Application I want to monitor? This could grow to many idling connections. So it isn’t really usable for this case.
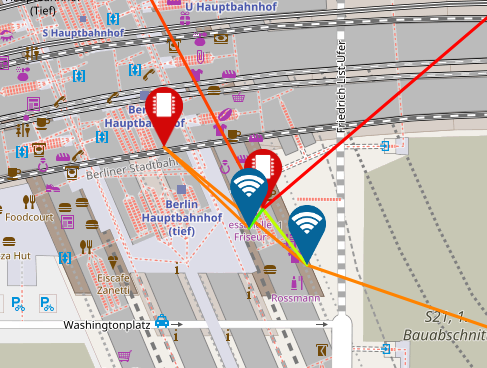
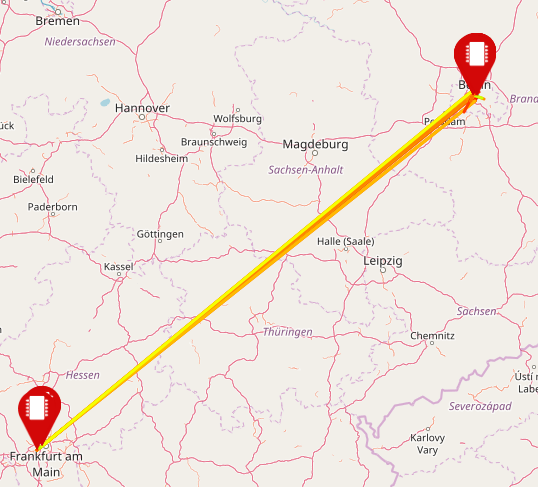
I just added a map showing the nodes and gateways. Furthermore it shows the link between the node and the gateways which received the packets. The lines color indicates the SNR. If there is no link between a node and a gateweay within 7 days the line is removed.
Of course nodes can only be shown if coordinates are specified. So it would be great if all of you could consider to enter the nodes (approximate) coordinates in the TTN console.
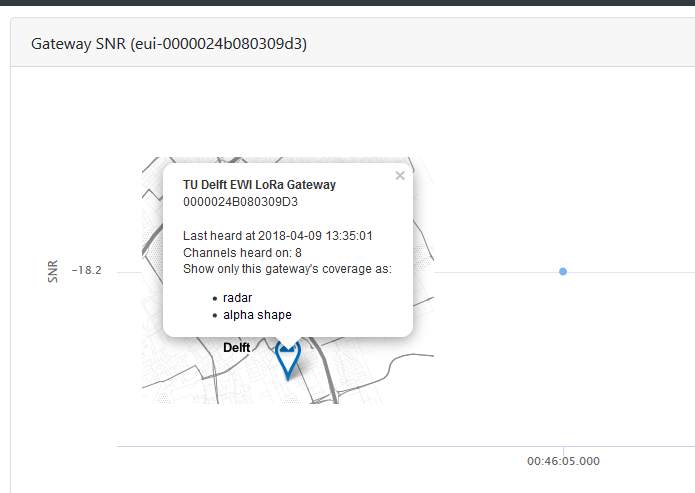
Today I captured a packet sent from a node in Apeldoorn at 65 meters high being received by a gateway in Utrecht over a distance of aproximately 60 km using TTNMon. The same packet was received in Delft over a distance of more than 112 km:
Below a composite of the registrations:
Because of this I have a feature request: please add the distance to the gateway with the gateway location, and altitude.
I added the distance next to the coordinates. Unfortunately your node didn’t send it’s coordinates with this packet. This is why TTNmon will show the gateway distance only starting with 10.04.2018 for your node.
I also fixed the map. It broke with a server migration. Links will be shown of the past seven days. However it currently only shows the links of a few hours as I didn’t record the data before. Previously it was generated from the data tables every 10 minutes which caused high server load and took a quite long time. Link information are now instantly updated.
Additionally gateways will now be removed from the map if they haven’t been heard within the last two weeks. This is the reason why some gateways disappeared in Amsterdam which were online during the TTN conference.
The node was in test until last friday. Then it was installed at the final location and in the weekend I added the location because I found that is was not set.
The rest of your information makes perfect sense. I will study the coming weeks behavior and will keep you posted.
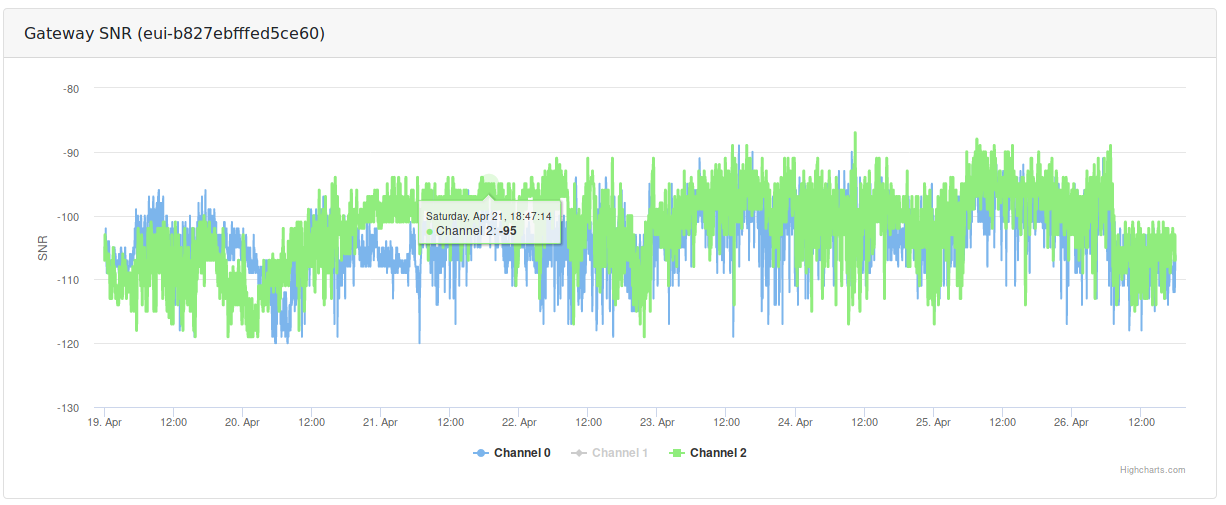
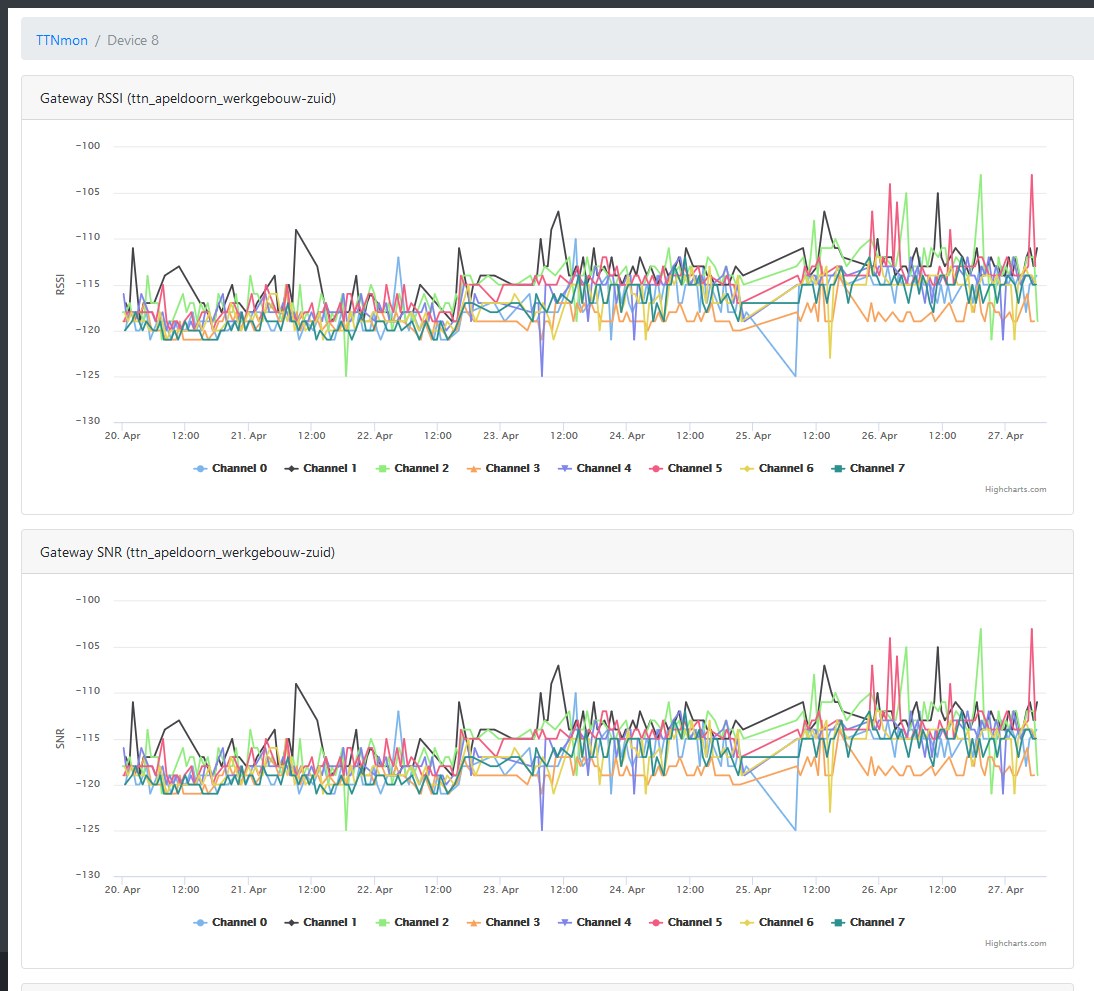
Gateways SNR and RSSI values are now sperated by their channel. This way high noise on a single channel can be easily identified.
Checking the map I noticed a few nodes with very long and still pretty good links. It seems that the nodes where moved. Can the owner verify this? I think I will have to implement a check for moved nodes to hide old links.