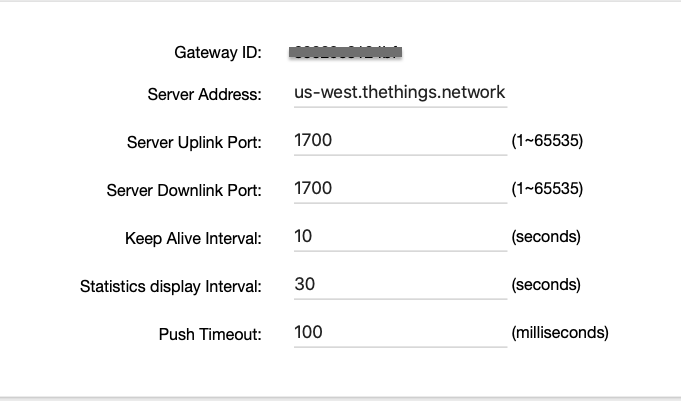
This has been going on for a minute but I’m just getting around to dealing with it. The TTOG seems to be properly configured, but it’s not showing up in my dashboard as on-line:
I have done this. Previously I had 2 gateways, so I powered the other one down (it was working fine, but was indoor-only) and once that one is powered off, I get no connections.
I’m basically trying to run a “Hello World” on an RPiZero. It was able to connect when the indoor gateway is on, but with that powered off, I get:
File "/usr/local/lib/python3.7/dist-packages/rak811/rak811.py", line 401, in join_otaa raise Rak811EventError(status) rak811.rak811.Rak811EventError: [Errno 6] Rx2 timeout
There is zero traffic in the gateway logs indicating even an attempt to connect by the client.
If the gateway logs do not list any valid LoRaWAN packets being received you should:
Check the frequency plan. Is your gateway listening at the frequencies your node transmits?
Check antenna connectors and cable and make sure you connected to right antenna to the right connector. TTOG has multiple connectors and you need to use the right one for the LoRaWAN antenna.
Make sure to have the node antenna at least 12 feet away from the gateway antenna. Larger distance is better.
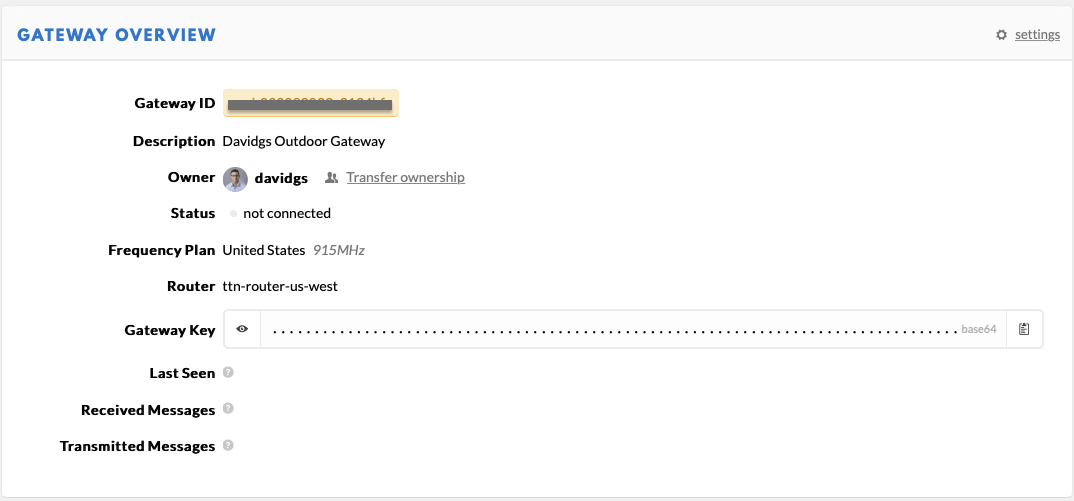
Sorry it’s taken me a minute to get back to this. I was taking the time to properly install it outside, with the antenna on. proper mast, etc. That’s all done. The gateway now shows up as on-line in the TTN Console.
Success! Nope!
I still cannot send data through that node. I have a RAK indoor LoRA access point, and when that is turned on, my LoRA PHAT on my RPi Zero can send data via that gateway. When I turn that gateway OFF, and attempt to use the TTOG, I cannot send data. I get the message: Join: at+recv=6,0,0 2020/09/30 18:27:47 failed to send: ERROR-5
And no messages are seen in the log on the TTOG.