Exactly what am I doing wrong that your not happy with?
It’s not hard this, the filters exist in V2 and I use them in diagnosing issues in both applications and devices (I’m guessing others do too), I just thought they would be of value in V3 given the information in the new live view is even greater.
You seems to be suggesting I am doing it wrong, I’m just using the live data to help me that’s all and I can see it being of no use once large numbers of devices populate an application - in fact the application live date view will be pointless without filtering as the data will volumes will be too high.
You’re indeed right, there isn’t much use for an “application” web view - as I was explaining earlier, you really should be routing your data into a data platform which you can query in whatever way you desire, and which will show you historic data in a way that the web view cannot.
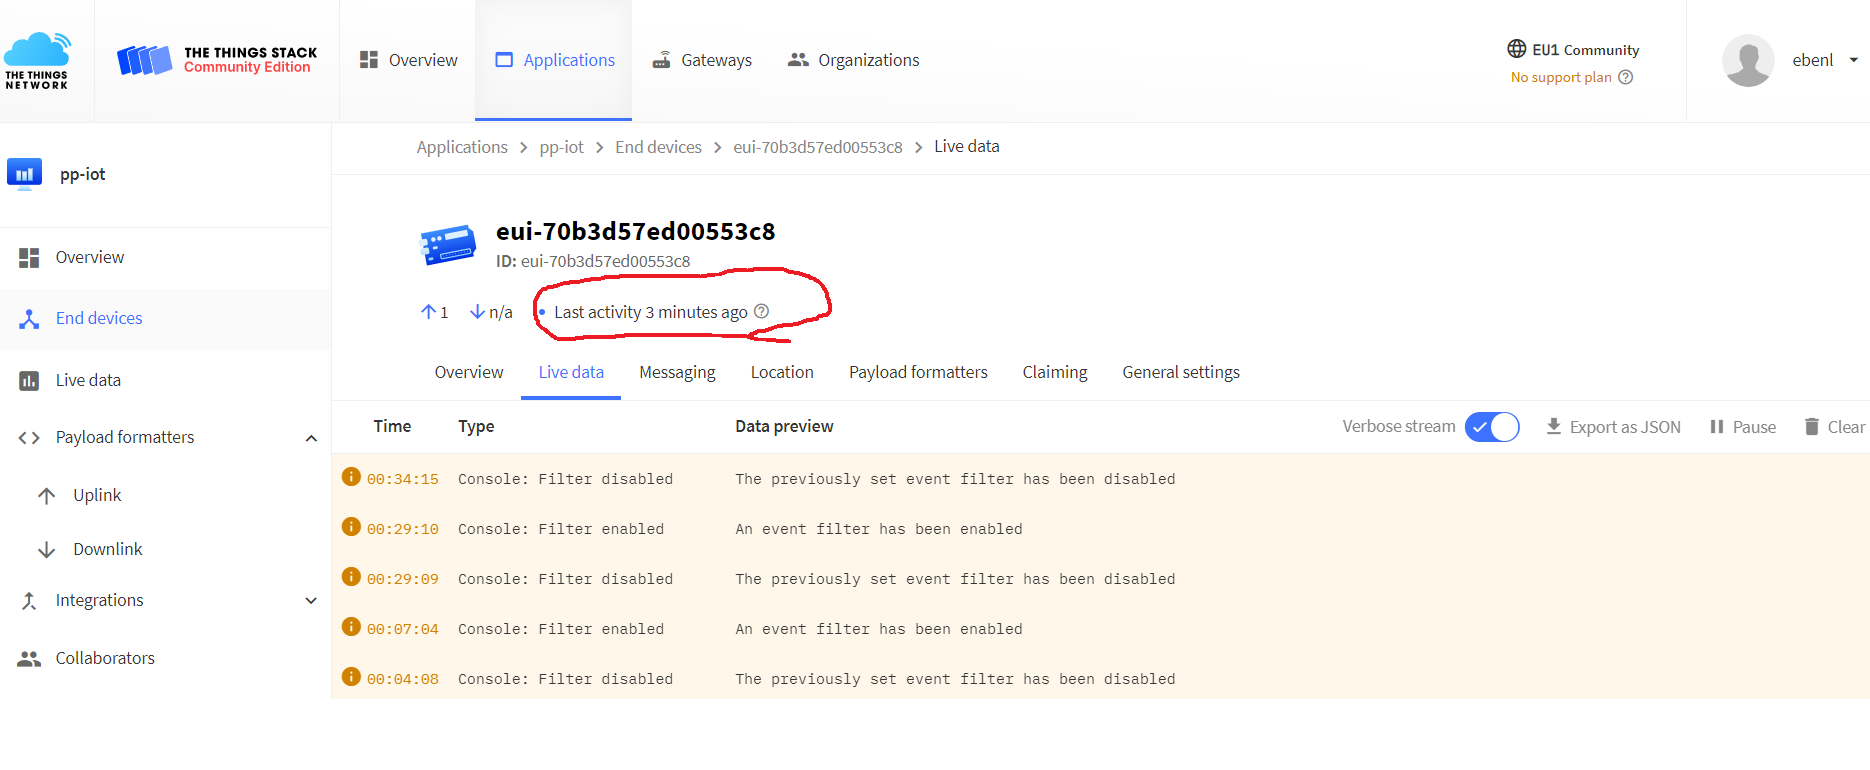
Note that filtering out verbose events by default is a feature coming up in the next release which will be deployed shortly thereafter. It is a first step towards improving the usability of the event views in the Console (as in taming the firehose ).
Cool - your’s is Lego Technic - mine is very much Lego Duplo.
@kschiffer, assuming you are at the heart of the Matrix, can you explain the correlation ids please - what are they, how might we use them and more importantly, particularly for mobile apps, can we turn them off?
Cool - your’s is Lego Technic - mine is very much Lego Duplo.
Not sure if that is good or bad. You mean that you would like to have even less data displayed (even more data filtered out)?
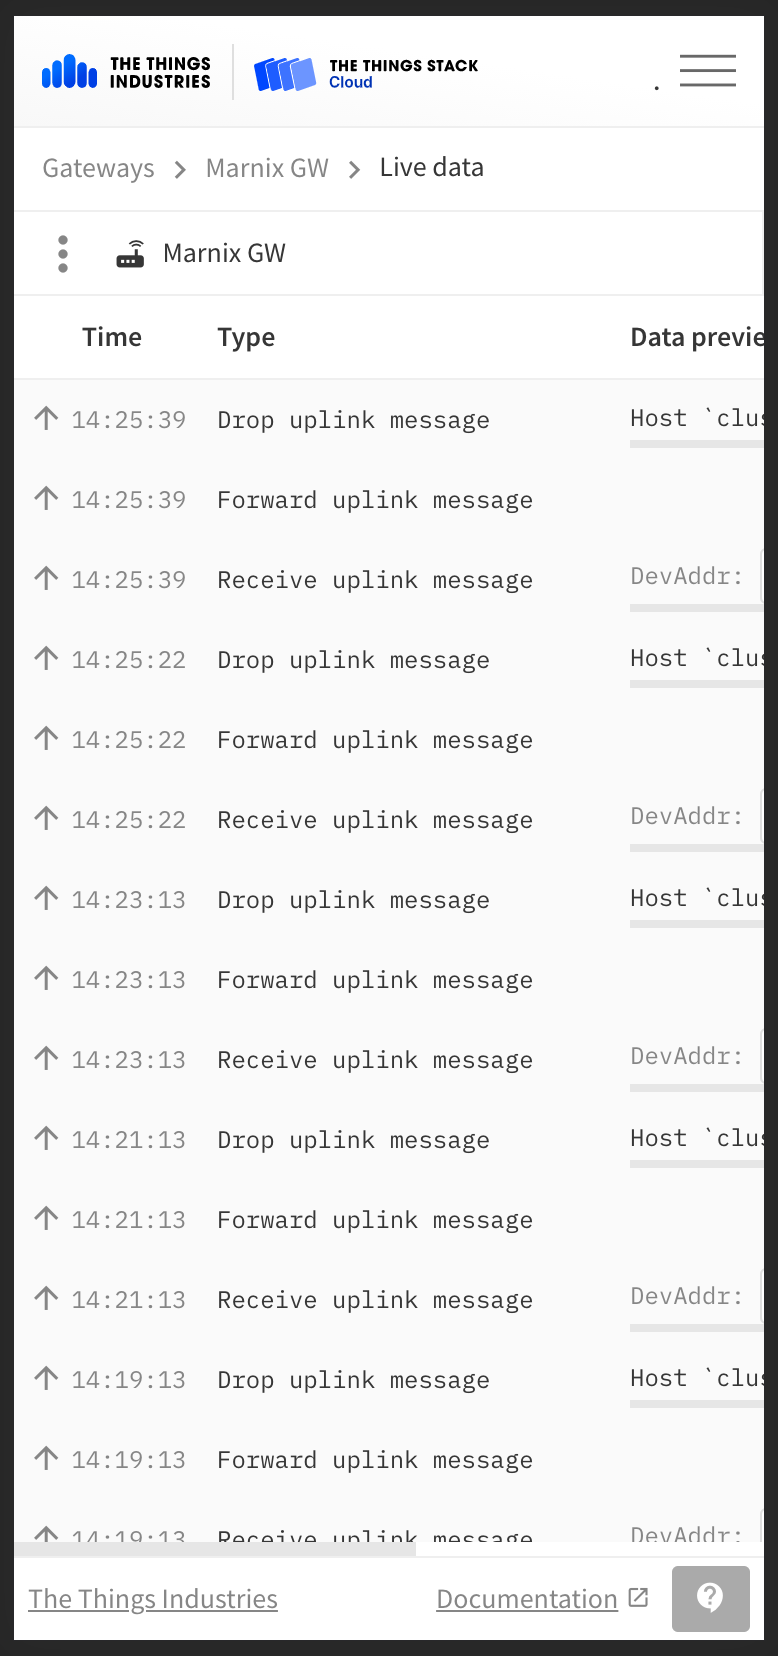
Correlation IDs are, as the name suggests, IDs that allow you to link an event to other event based on a specific topic. E.g. for gateways, you’ll see a correlation ID for the connection, allowing you to identify all gateway events that are related to this particular gateway connection. Another topic would be e.g. an uplink. You will see that all gateway events relating to the same uplink will share the same correlation ID starting with gs:uplink:.
In the future we will use these IDs in the Console to highlight related events.
I’m not exactly sure what you mean by “turning them off”. If you mean to make the event stream omit the correlation IDs (or any other event property), then yes, something like this is in consideration.
Both - I like yours for the detail but when I’m running round the garden pouring water on to sensors, I’d rather have a really simple display that just shows me that an uplink was triggered which means the alarm was triggered. I’ve got something that replicates the v2 traffic view without the expanding detail working, just needs a bit more tidy up before beta-testing.
Plus mobile needs the bare minimum unless you have an A2 side iPad Air.
But when it gets gritty, return to “The Source” - the official console - what would be considered “The Truth”.
I’d not worry about the many variants of live data that people could aspire to - the API’s are there for people to roll their own and it means the wife is happy because I’m fully occupied.
Understand the correlation id’s now - very good - but mostly they are wasted bytes for the average console view - if I run out of things to do I could get some API feeds running and have different screens linking the entries via the correlation-ids - probably need to be a glass freestanding monitor with gesture control so I can swipe widgets around.
I see. Yeah indeed you’re always free to come up with your own interface that suits your specific needs (which is part of the power of TTS). Obviously though in the Console we try to come up with a design that suits as many needs as possible. As is known, we’re not quite there yet, but improvements will come in steadily now.
Btw, regarding mobile, the TTS Console is fully responsive and also the event views are optimized for mobile screensizes (obviously with some limitations). We will flesh this out further with the ability to hide columns as well, but it can already be used pretty smoothly (imho).
I’m very much aware of the trade-off. Still what I mean is a sane approximation that serves the most common use cases without sacrificing usability. Any choices there need to be made with careful consideration. We’re not planing to bloat event streams with millions of options just to cover every last use case.
This is coming up.
That is the kind of “every last use case” use case I was thinking of .
Ok guys all sounds good but in last case please dont ask/expect me to be the tester (though British summer will likely be fitting environmental test! )
 ).
).