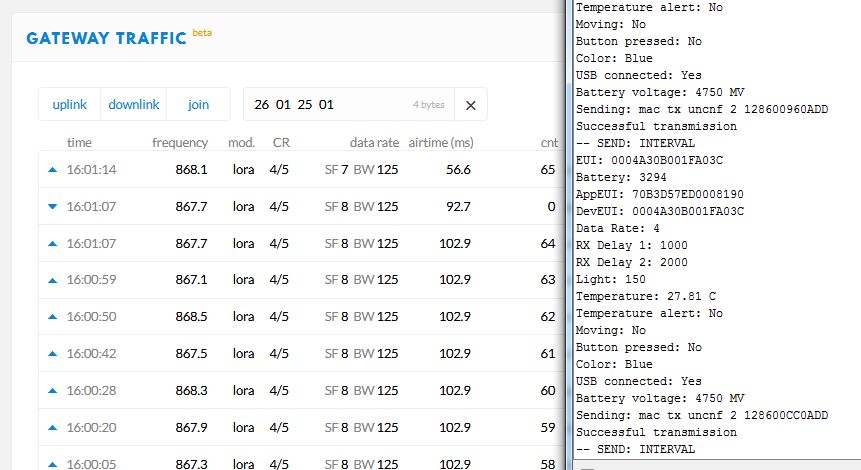
Hi,
I’ve 4 nodes of the same type that after some time from the installation I found with SF12 even if they have good snr and are really close to the gateway.
I switched off/on one of these nodes (1060bd) and, in order to facilitate the adr setting from TTN server (all the uplink msg from nodes have the FCtrl.ADR = true), I sent a downlink msg to it (14:47:49).
As reported in the picture below, the node switch to SF8.
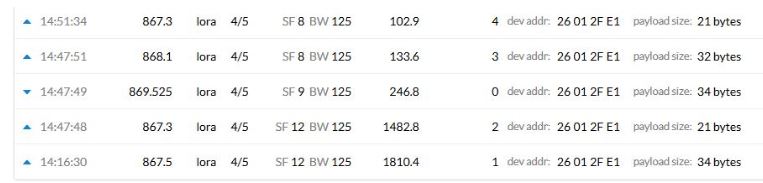
I applied the same procedure to another node of the same type (1060D9) without any success. Sending a downlink msg to it after more than 20 uplink msg, the SF always stay on 12.
Considering what is reported in https://www.thethingsnetwork.org/docs/lorawan/adr.html
(ADR requests are no longer scheduled or sent if the device refused several ADR requests) and the possibility that some of the nodes could be active for some time without any gateway in their range, I’ve also imagined that some nodes could be put in a let’s say “adr blacklist” by the TTN server. So I deleted the device from TTN and recreated it, but anything change for the SF.
Any idea ?
Thanks,
Gianluigi
To see if TTN is sending an ADR request for that second node:
-
What’s the payload size of that downlink of the second node? (Where for the first node it’s 34 bytes.) Posting the actual payload might help too, so we can tell if the ADR is as expected.
-
Does clicking the downlinks give you any additional trace information that relates to ADR?
(Also, I find the frame counters confusing. Like the first screenshot shows low values for the uplink frame counter; I wonder when TTN resets the ADR statistics it gathered when a node is restarted. And the second screenshot shows it’s the 3rd downlink, so the first downlinks were transmitted before TTN got 20 uplinks too. I guess that’s hard to debug.)
Many thanks Arjan.
Unfortunaltely the console output isn’t no more available because after about half an hour I always get this error (“Something went wrong refreshing the token: oauth2: cannot fetch token: 400 Bad Request Response: {“error”:“invalid_grant”,“error_description”:“Refresh token not found”}”) and the page disapppear.
Do you know if there is any way to avoid this timeout viewing the console output ?
Anyway logging the download trafic with mosquitto, the 09:29:46 msg of the second node report this contents (timestamp hour it’s coming from an AWS clocks with an our before)
Feb 17 08:29:46 senlab-t/devices/1060d9/events/down/sent {“payload”:“YEcmASaAAgACoO7QyXTRd8WODG+faDszaKBELcM=”,“message”:{“app_id”:“senlab-t”,“dev_id”:"1060d ",“port”:2,“payload_raw”:“AQcBAQCWAHECAJYAJgkADw==”},“gateway_id”:“eui-1dee0eb900028599”,“config”:{“modulation”:“LORA”,“data_rate”:“SF9BW125”,“airtime”:226304000,“counter”:2,“frequency”:869525000,“power”:27}}
I hope the evaluation of this msg with the lorawan-packet-decode could help to evaluate the contents.
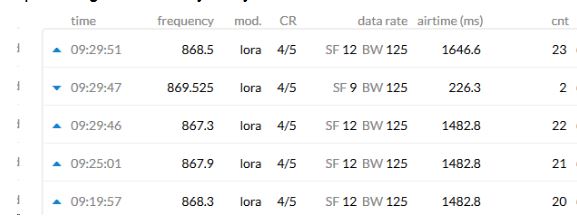
About the download cnt, I try to sent some download msg before the one reported in the screenshot.
Considering the interesting Mario’s post https://mariozwiers.de/2019/01/04/adaptive-data-rate-the-things-uno-rn2483/, do you think that after more 64 up msg, TTN server should send the msg to set the adr ?
Gianluigi
Indeed, that has no ADR MAC commands in FOpts there. However, it does carry application data; is that what you expected? (So, you did not send an empty downlink? That’s fine, of course, just want to be sure.)
I’m not sure. Even after the device has sent an ADRAckReq then TTN is not even required to reply immediately, and can again wait for at most 32 uplinks, to piggy-back on a regular downlink. Also, things are different when the node is at SF12, which TTN tries to avoid. For that, it might show “avoid high sf” in the Trace part in TTN Console, and not await a device’s ADRAckReq at all. So while at SF12 you should not have to wait that long. Also, your devices are all the same.
As for TTN Console timeouts: I’ve seen it many times too. MQTT is indeed much more reliable when debugging, but then you don’t have the Trace parts which can be really helpful.
As an aside: it seems that this blacklist is maintained by a simple counter in the device’s metadata, ADR.Failed. And it seems this counter is only incremented if a device does send a LinkADRAns MAC command, but in that command does not confirm all settings.
There is code to detect a missing LinkADRAns, but that code does not seem to increment that counter. So, if the node does not send such MAC command at all (including if it never received it to start with), it seems it might not be registered as a failed ADR command. Hence, if the node does not receive the ADR Request from the server, then I don’t think it will be banned…
I confirm that I sent an application command in order to modify the reporting time of the node.
I agree, the console could really help in debug, but sometimes (… when I need it ![]() ) it diseappears.
) it diseappears.
In the meantime I will continue to collect the downlink msg with mosquitto and let’s see if something will arrive from TTN backend …
Gianluigi
Given my previous answer (which I posted while you writing yours) I’d say it’s banned until deleted and re-created. The maximum failures is 3. But again: I think it’s only banned when in the next uplink it does acknowledge it received the ADR request, but then tells TTN it refused one of the settings, being data rate, power and/or channels. In other words: if it could not comply to TTN’s request, in which case repeating it makes no sense. This would better be described as “rejected” rather than “failed”.
Keep the gateway’s Traffic page in TTN Console open to be able to see the Trace part when clicking an uplink or downlink!
Beware:
And:
In your case, the latter seems okay, as the downlinks are in RX2, 869.525/SF9, which is different from the uplink channel anyway. The first might apply though, making the ADR downlink not being handled on the device.
Are all nodes using OTAA? Or when using ABP, did you adjust the RX2 settings to match the non-standard TTN settings? (I guess this is fine, as it would apply to both devices, and one works just fine.)
Oh, and all of the above might not apply to you, as we already determined that at least one of the downlinks did not hold any ADR command at all…
The gw is about 15 meter from the nodes and I’m only using OTAA.
I’m attaching the trafic log files about the 10609d node both in up and down direction, with some comments inside.
No downlink messagge from yesterday midday, till this morning when I moved the nodes from home to work site. When I arrived at work, one downlink was sent by TTN, but SF is always 12.
1060d9-up-18022019.txt (127.8 KB)
1060d9-down-18022019.txt (1.8 KB)
I try something more with another node, 1060bd.
Yesterday this node opeartes with a SF7, then I shielded it for all the night and this morning I remove the shield and I found it with a SF12.
Then TTN start to send downlink msg every time the node send an uplink (every hour).
This is the mosquitto downlink log from yesterday till now:
Feb 17 09:18:27 senlab-t/devices/1060bd/events/down/sent {“payload”:“YOEvASaAFwACYNKhHPXwO+Zs3isTHM1fx1Ffv0A=”,“message”:{“app_id”:“senlab-t”,“dev_id”:“1060bd”,“port”:2,“payload_raw”:“AQcBAQcIBuMCBwgDXwkADw==”},“gateway_id”:“eui-1dee0eb900028599”,“config”:{“modulation”:“LORA”,“data_rate”:“SF7BW125”,“airtime”:66816000,“counter”:23,“frequency”:867700000,“power”:14}}
Feb 18 06:49:52 senlab-t/devices/1060bd/events/down/sent {“payload”:“YOEvASaFGAADVf8AAzz/Bqw=”,“message”:{“app_id”:“senlab-t”,“dev_id”:“1060bd”,“port”:0},“gateway_id”:“eui-1dee03a372f1126a”,“config”:{“modulation”:“LORA”,“data_rate”:“SF9BW125”,“airtime”:164864000,“counter”:24,“frequency”:869525000,“power”:27}}
Feb 18 07:49:39 senlab-t/devices/1060bd/events/down/sent {“payload”:“YOEvASaKGQAFA9KthANV/wADLIV4/Q==”,“message”:{“app_id”:“senlab-t”,“dev_id”:“1060bd”,“port”:0},“gateway_id”:“eui-1dee03a372f1126a”,“config”:{“modulation”:“LORA”,“data_rate”:“SF12BW125”,“airtime”:1482752000,“counter”:25,“frequency”:869525000,“power”:27}}
Feb 18 08:49:42 senlab-t/devices/1060bd/events/down/sent {“payload”:“YOEvASaKGgAFA9KthANV/wADYCLDlQ==”,“message”:{“app_id”:“senlab-t”,“dev_id”:“1060bd”,“port”:0},“gateway_id”:“eui-1dee1a0a6e94d4bf”,“config”:{“modulation”:“LORA”,“data_rate”:“SF12BW125”,“airtime”:1482752000,“counter”:26,“frequency”:869525000,“power”:27}}
Feb 18 09:49:50 senlab-t/devices/1060bd/events/down/sent {“payload”:“YOEvASaKGwAFA9KthANV/wADJbGK9Q==”,“message”:{“app_id”:“senlab-t”,“dev_id”:“1060bd”,“port”:0},“gateway_id”:“eui-1dee1a0a6e94d4bf”,“config”:{“modulation”:“LORA”,“data_rate”:“SF12BW125”,“airtime”:1482752000,“counter”:27,“frequency”:869525000,“power”:27}}
Feb 18 10:49:41 senlab-t/devices/1060bd/events/down/sent {“payload”:“YOEvASaKHAAFA9KthANV/wADHOnA3Q==”,“message”:{“app_id”:“senlab-t”,“dev_id”:“1060bd”,“port”:0},“gateway_id”:“eui-1dee1a0a6e94d4bf”,“config”:{“modulation”:“LORA”,“data_rate”:“SF12BW125”,“airtime”:1482752000,“counter”:28,“frequency”:869525000,“power”:27}}
Feb 18 11:50:04 senlab-t/devices/1060bd/events/down/sent {“payload”:“YOEvASaKHQAFA9KthANV/wADtk6xvQ==”,“message”:{“app_id”:“senlab-t”,“dev_id”:“1060bd”,“port”:0},“gateway_id”:“eui-1dee1a0a6e94d4bf”,“config”:{“modulation”:“LORA”,“data_rate”:“SF12BW125”,“airtime”:1482752000,“counter”:29,“frequency”:869525000,“power”:27}}
Feb 18 12:49:36 senlab-t/devices/1060bd/events/down/sent {“payload”:“YOEvASaKHgAFA9KthANV/wADcpP3+A==”,“message”:{“app_id”:“senlab-t”,“dev_id”:“1060bd”,“port”:0},“gateway_id”:“eui-1dee1a0a6e94d4bf”,“config”:{“modulation”:“LORA”,“data_rate”:“SF12BW125”,“airtime”:1482752000,“counter”:30,“frequency”:869525000,“power”:27}}
Feb 18 13:49:56 senlab-t/devices/1060bd/events/down/sent {“payload”:“YOEvASaNHwACFwEFA9KthANV/wADQ9uFew==”,“message”:{“app_id”:“senlab-t”,“dev_id”:“1060bd”,“port”:0},“gateway_id”:“eui-1dee1a0a6e94d4bf”,“config”:{“modulation”:“LORA”,“data_rate”:“SF12BW125”,“airtime”:1482752000,“counter”:31,“frequency”:869525000,“power”:27}}
I’ve also catched the last one downlink (13:49:56) with the TTN console, that shows the ADR commands:
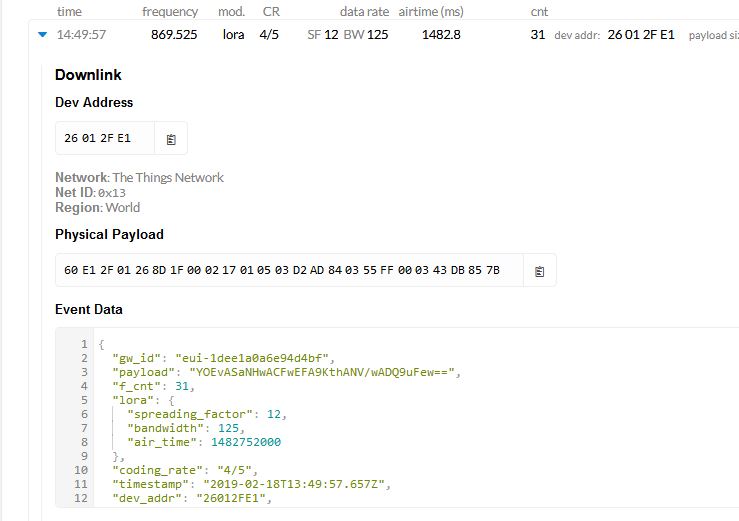
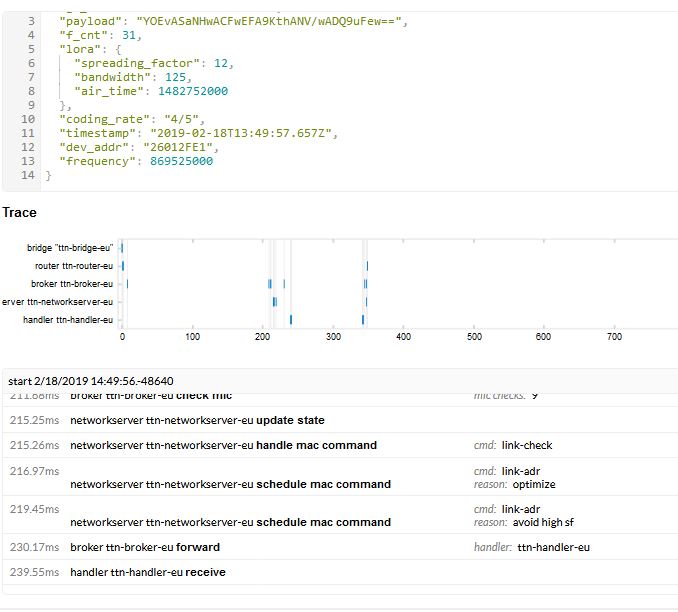
I don’t know if the link-adr commands are correct, from the mosquitto log there is a “config” payload that I don’t know if refers to the current condition or represent a configuration command.
In case the adr command are really trying to lower the SF, it could be that the problem is the gateway or the node.
Gianluigi
Given the frequency 869.525, the downlinks are all in RX2, except for the very first one, which is in RX1 (and is the Join Accept). Of those RX2 downlinks, only the first is sent at the TTN-specific SF9 (as expected), all others use the LoRaWAN default SF12 (as a workaround).
Now, an example has proved that, when using RX2, TTN surely is smart enough to repeat ADR on SF12 if nothing changed when the node ignored the ADR downlink in the documented SF9. The same can been seen in the code. But I feel TTN should not keep using SF12 for ADR in RX2 then†; assuming your node is using the TTN specific settings that it got in the EU868 OTAA Join Accept, it will never receive the RX2 downlinks when TTN uses SF12…
On the other hand, maybe the bug is that it should not repeat forever, but only once. And maybe it uses SF9 again when the node sets ADRAckReq at some later time again. And the other nodes do accept the RX2 SF9 downlink?
That’s the gateway’s configuration for the downlink. Like frequency, data rate and power that is to be used for the transmission. It’s not some configuration payload that is sent to the node.
The data sent to the node is taken from, e.g., "payload": "YOEvASaFGAADVf8AAzz/Bqw=" for the SF9 downlink, which indeed is a MAC command in FOpts = 0355FF0003, which according to the 1.0.2 specification and the EU868 regional parameters decodes to:
- 0x03 = LinkADRReq MAC command
- 0x55 = DataRate_TXPower: data rate 5 (SF7/125KHz); TX power 5 = 6 dBm
- 0xFF00 (LSB) = 0b00000000 11111111 (MSB) = ChMask = channels 1 thru 8
- 0x03 = 0b00000011, so ChMaskCntl = 0b000, so indeed the bits in ChMask above directly refer to individual channels. This also sets NbTrans = 3, telling the node that each unconfirmed uplink should be transmitted 3 times.
(I don’t understand that, but I assume it’s unrelated to your problems, as I assume it’s the same for the other nodes…)
And the first SF12 downlink, which your node will not have received, gives FOpts = 0503D2AD84 0355FF0003, which indeed first tells the node about the TTN specific RX2 settings:
- 0x05 = RXParamSetupReq MAC command
- 0x03 = DLsettings: RX1DRoffset = 0 (RX1 downlink uses the same data rate as the preceding uplink) and RX2DataRate = 3 (SF9/125kHz for RX2)
- 0xD2AD84 (LSB) = 0x84ADD2 (MSB) = RX2 frequency 869.5250 MHz
…followed by the LinkADRReq MAC command 0x0355FF0003 as described above.
So, all above aside: why didn’t that specific node receive or process the SF9 downlink? (As other nodes do process it, so certainly receive it, I doubt the gateway is to blame.)
† It seems that for OTAA, this was fixed in October 2019: RX2 fallback leads to endless downlinks · Issue #767 · TheThingsArchive/ttn · GitHub, for devices that joined after that fix.
Ah, the code seems to show that this number is increased when packet loss has been detected. Surely shielding all night has made TTN detect that. In time, this number will decrease again…
Thanks Arjan fo your detailed and really interesting explanation, I’ll let you know about any news.
Gianluigi
In order to identify where is the problem, I’m trying debugging the connection with a ThingsNode.
When I download a byte on the port 0 of the node, I’m able to see it in the log of the node, even if the msg will be reported related to port 2.
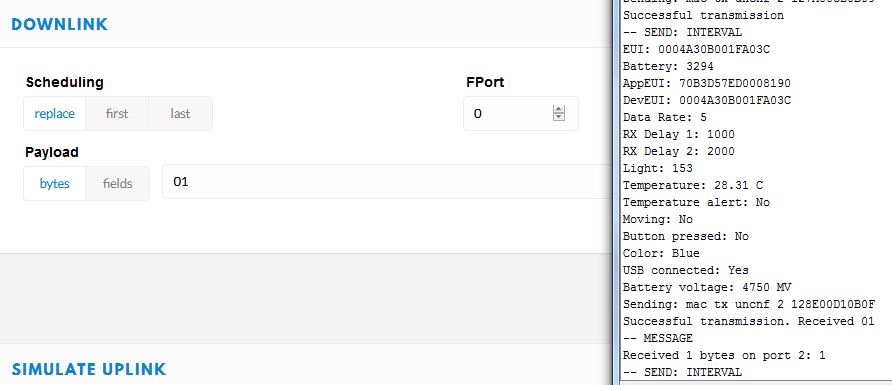
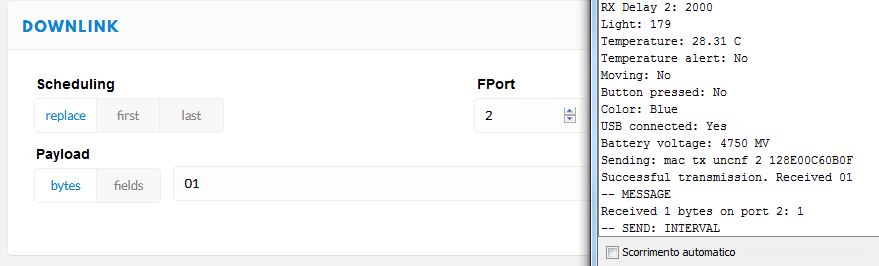
When I send to port 2 it’s correctly reported oin port 2
Setting the adr on in the node (ttn.reset(true)), when the msg cnt is 64, TTN correctly send an adr command to the node (14:01:42), but there isn’t any trace of this msg in the node debug console.
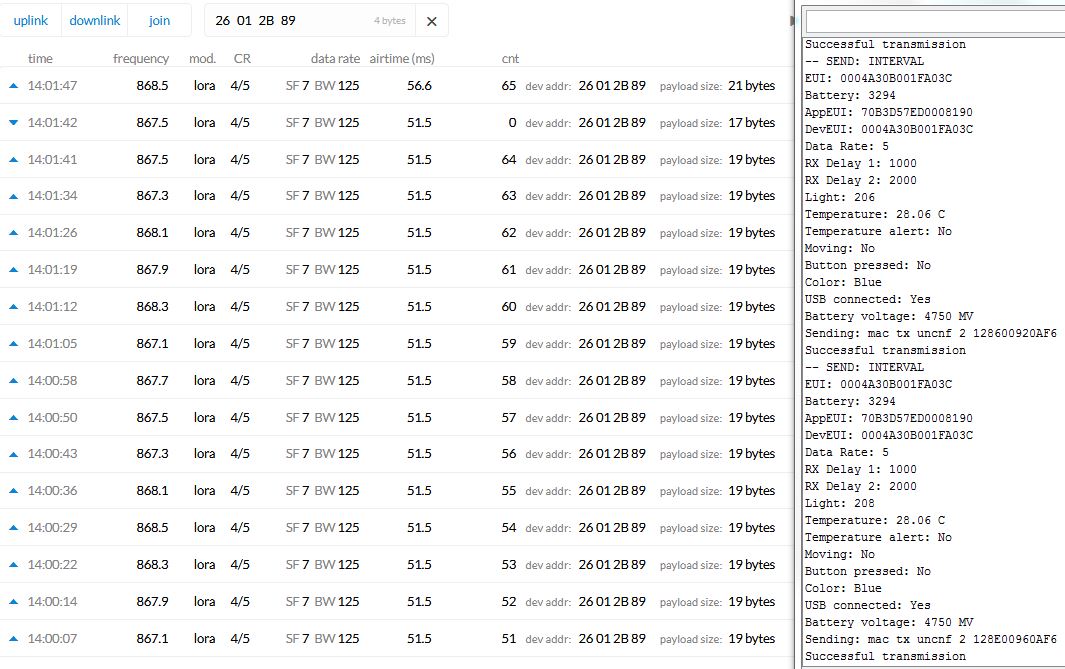
Considering that in the node code I’m using the method “ttn.onMessage(message)” for receiving the download msg, is it correct that it catchs only the application level or should it also get the mac msg ?
Gianluigi
That’s not supported; port 0 is reserved for downlinks without any application payload. That is: downlinks that only hold network MAC commands.
I assume TTN actually fixes this for you. It surely does that if it includes a MAC command.
Yes. Any MAC commands will be handled by the RX2xx3 chip.
Thanks Arjan,
so if I correctly understand, I’m not able to verify if the gateway forward the adr request to the node by mac command.
Anyway at the beginning of the log the mac command sent by the node are reported.
The gateway won’t change whatever is in the downlink. It cannot even read all its contents and surely cannot change the MIC, as it does not know the secrets.
But: you can decipher the downlink using the gateway’s log, or the gateway’s Traffic page in TTN Console. So if you see that a downlink was received in the node’s log, you’ll also know if that included any MAC commands. Of course, you won’t know if the RN2xx3 handled those…
You started with:
Maybe they actually have different versions of the RN2xx3 chips, or their firmware?
The version 1.0.4 you show in your last screenshot is slightly outdated but probably good enough.
Sorry, may be I wasn’t clear enough.
The last test wasn’t carried out with one of the four nodes that give me the original problem, because I could’t conect with them to see theirs log.
For check if the adr commnad sent by TTN reach the node, I used another lora node (“The Things Node”).
In the Arduino IDE debug console of this node, I’m able to see the downlink msg that I manually sent from the TTN console, but when the TTN console shows an adr command sent from TTN to “The Things Node” after 64 uplinks, there is not trace of this msg in the Arduino IDE debug console of the node.
Yup, it depends on the LoRaWAN implementation if you can see any MAC commands in the log. For example, for LMIC on Arduino one can enable verbose logging to see ADR MAC commands.
It’s probable that the mac msg are not logged on the node console.
I set SF 8 and enabled adr and after 64 msg it correctly swith from SF 8 to 7 even if the mac command it’s not reported in the log.