To start with - Make sure GW & node not too close with some absorber in between - e.g. window/wall etc… (common newbie new start problem)
Then if looking for help you really need to provide detail, details, details… we need to know what you are seeing, logs etc as none of the forum volunteers are telepathic
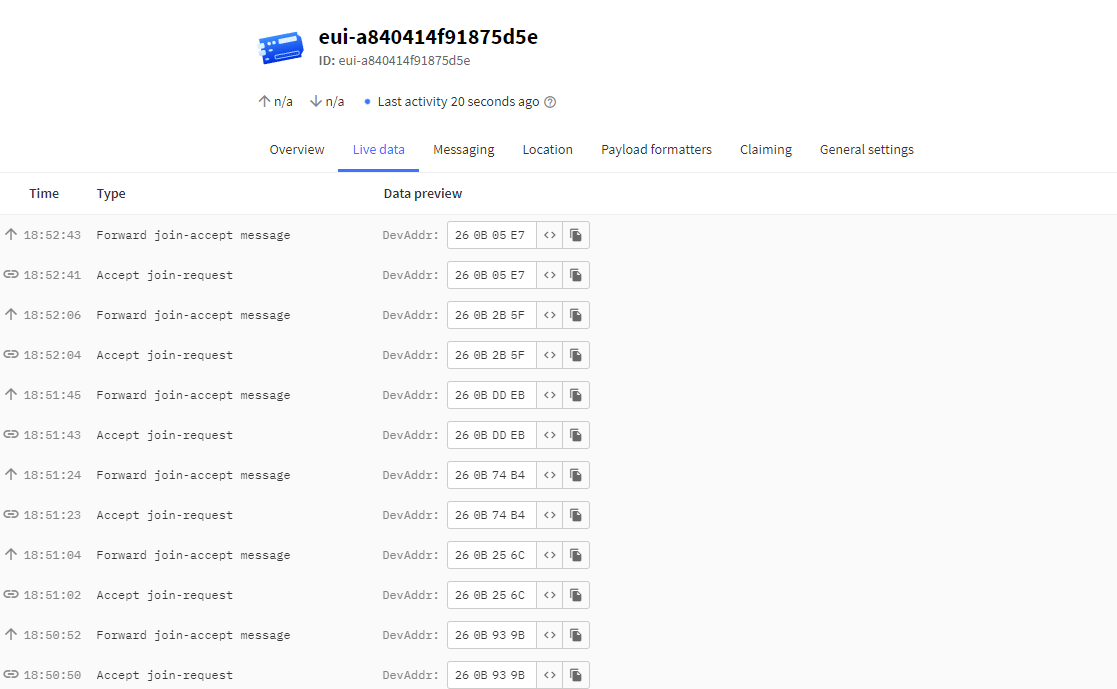
I tried further and further away which didn’t make any difference so tried driving to another nearby gateway and the node behaved differently so I think it may potentially be the gateway end rather than the node end.
On the other gateway rather than getting stuck in the same link the behaviour is
18:33:25 Accept join-request
18:33:27 Forward join-accept message
18:33:34 Forward uplink data message
18:33:34 Update end device
Ill post some logs when I get home and not sitting in my car on a laptop outside some random building
as I said in the post my intention was not to double post but to have the question categorised in the right location and with a more accurate description now I know more about the problem so that it would be easier to find for others in the future if they had a similar issue.
I don’t have the ability to delete the original post but if a moderator is able to then please do and ill continue on the new post I created
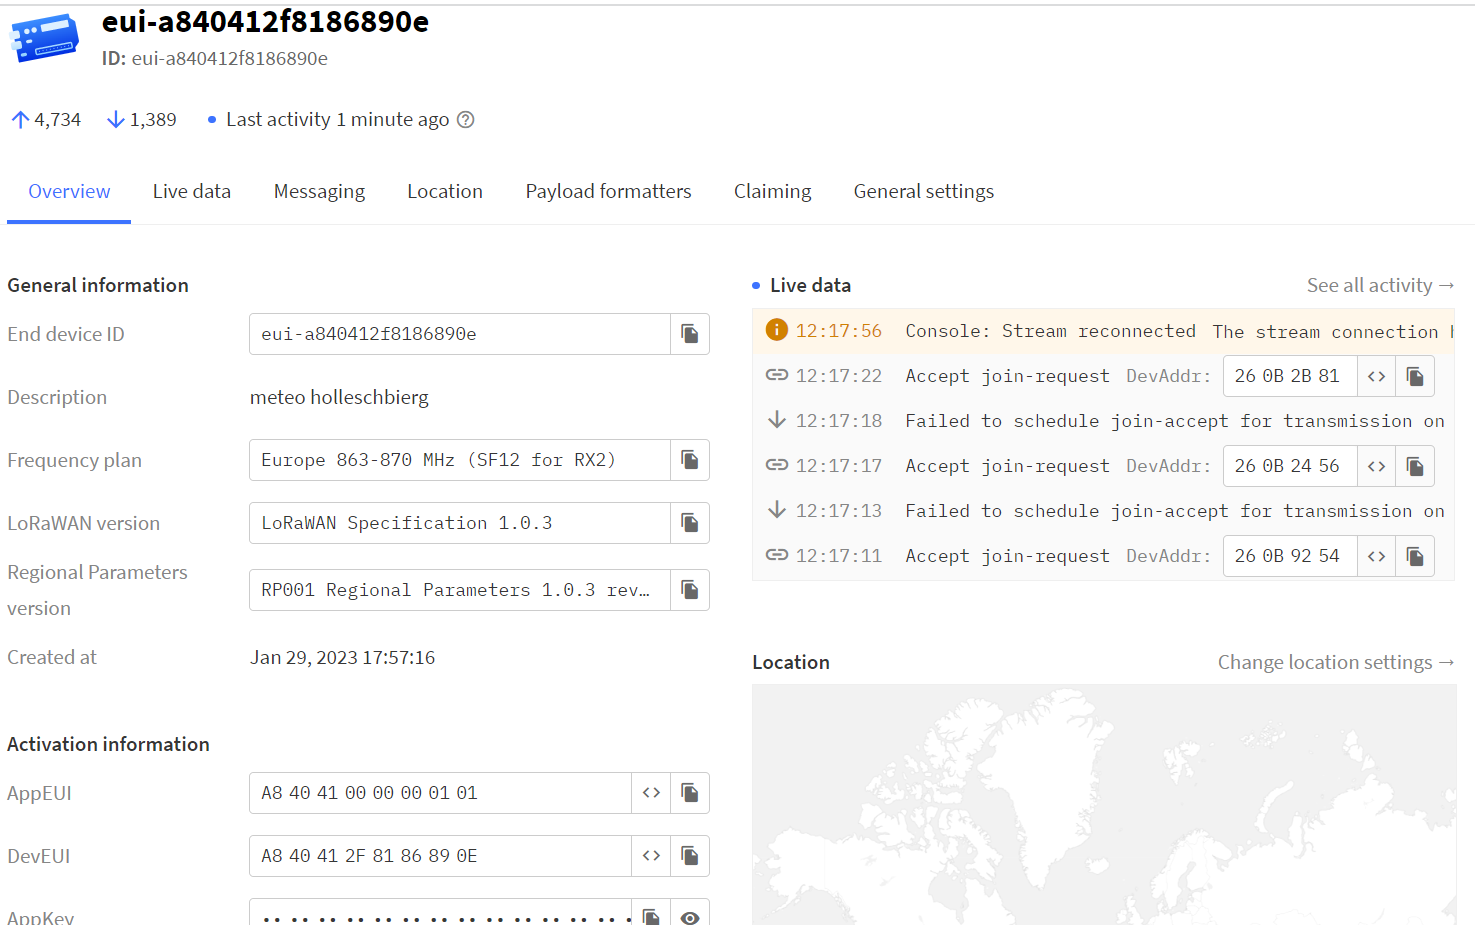
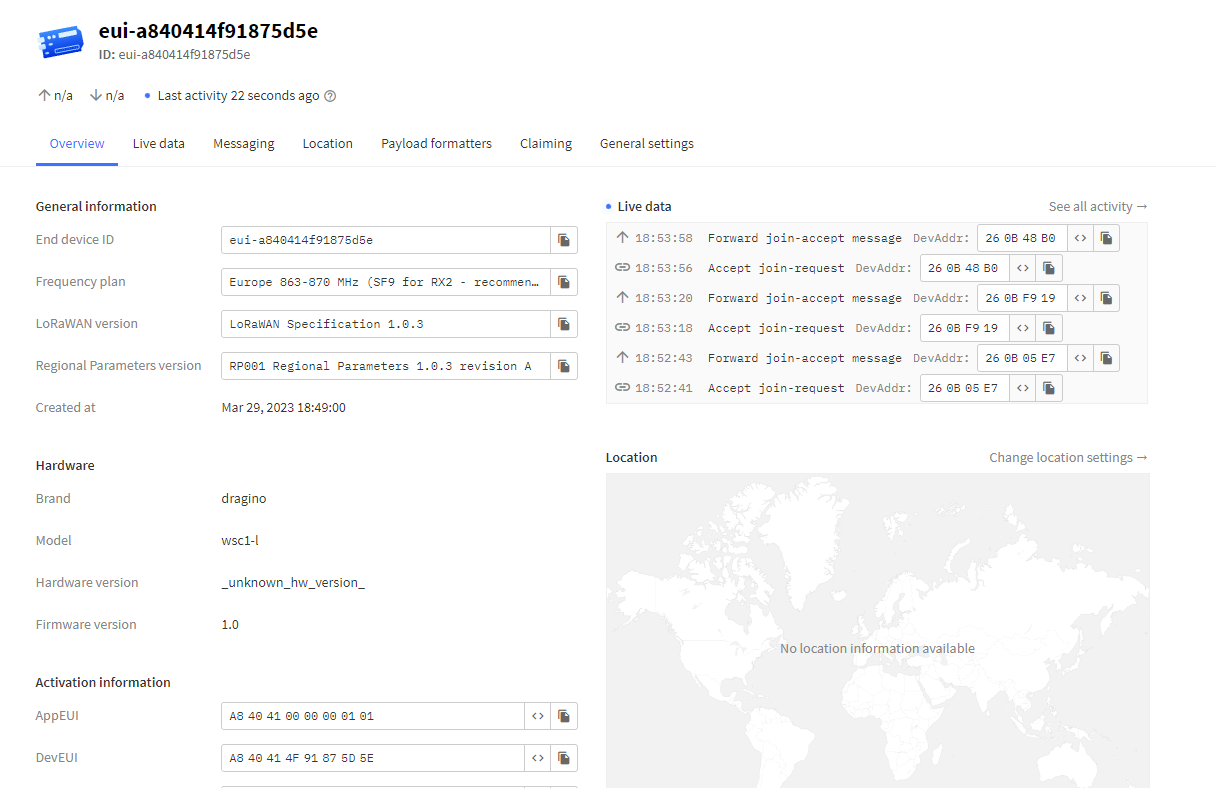
I have a WSC1-L from Dragino and a Dragino DLOS8N Outdoor Gateway.
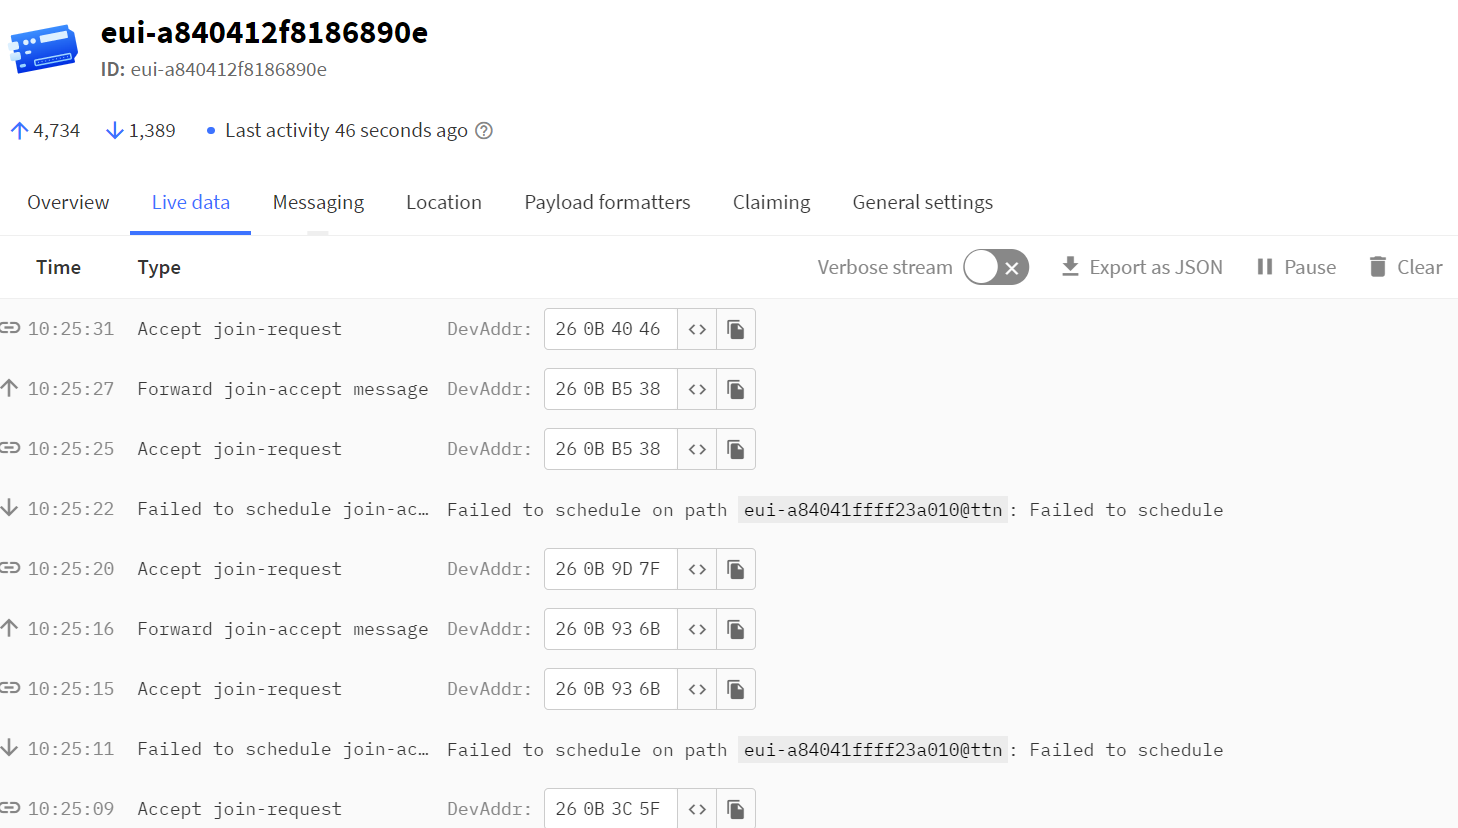
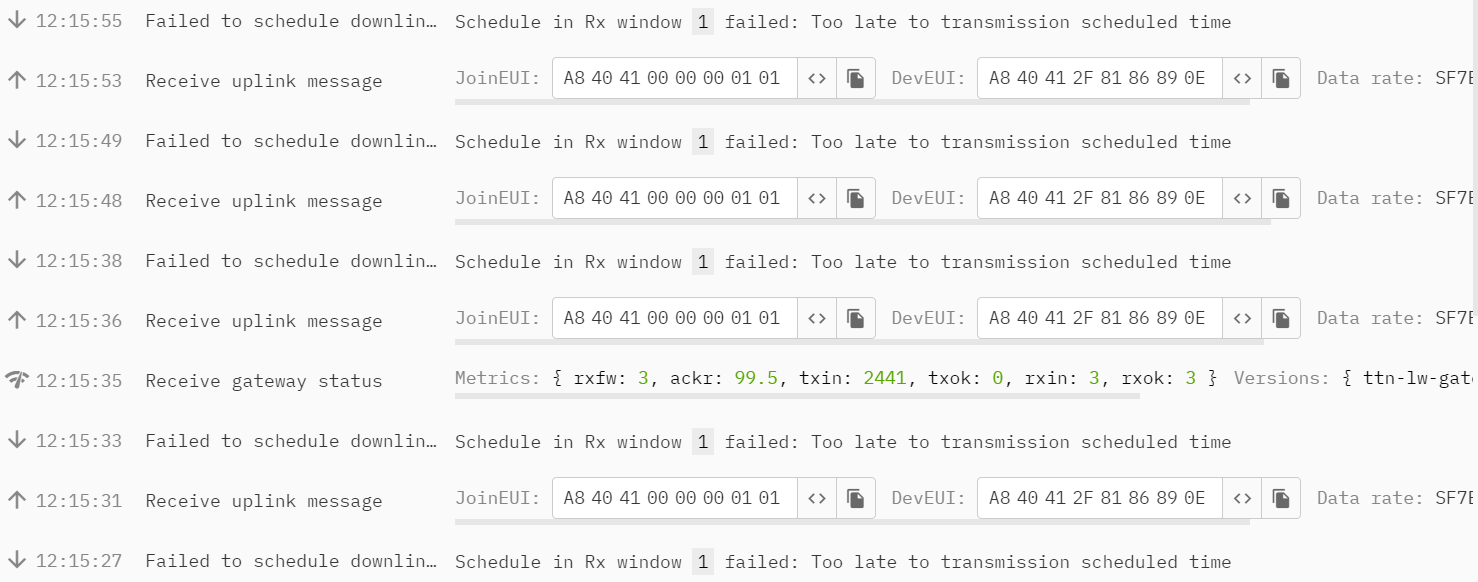
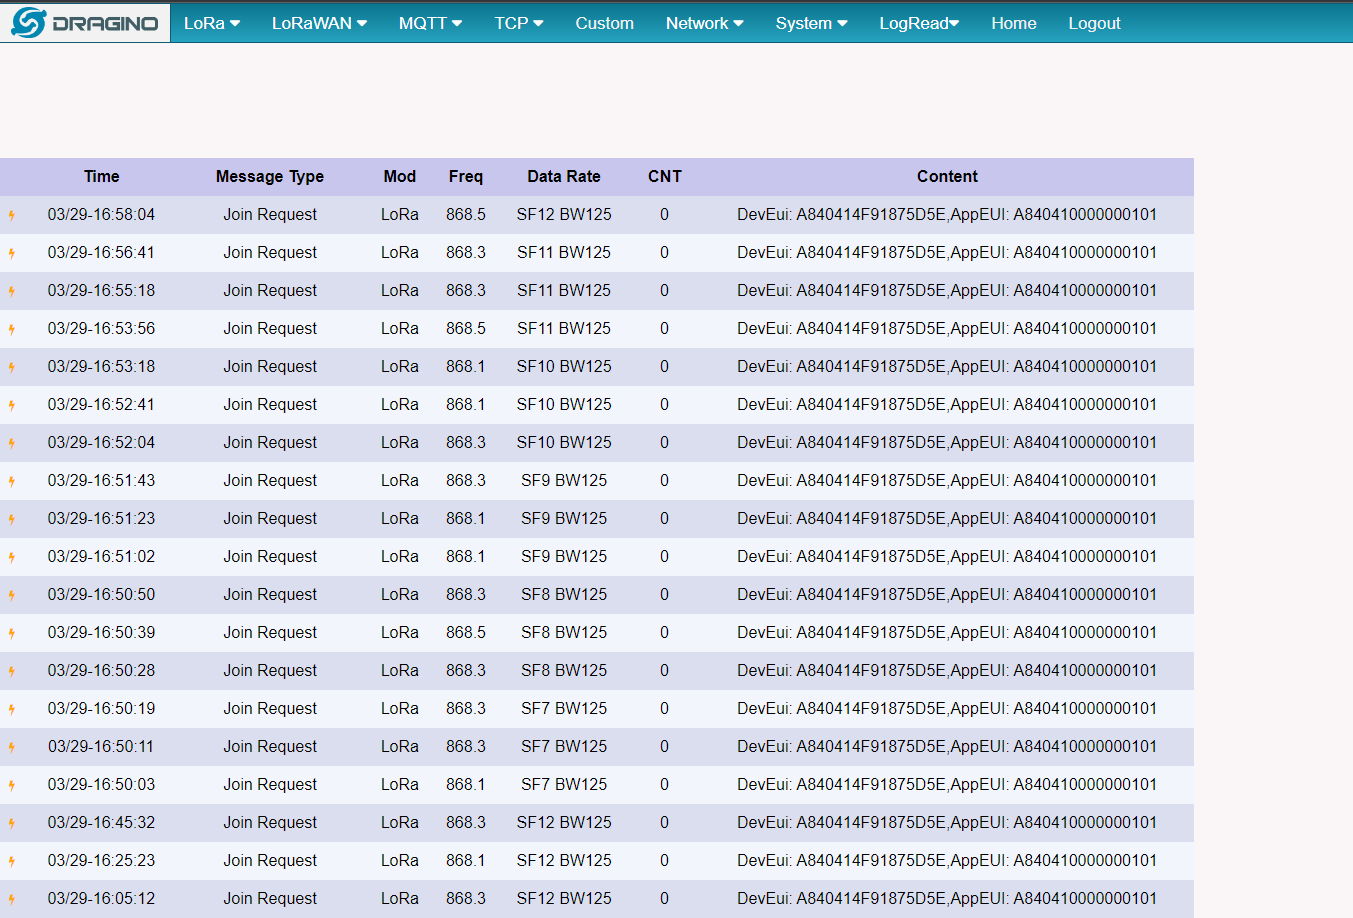
THE RSSI Value -107 and it worked for 3 works, the wsc1-l sends data to the gateway every 5 minutes now suddendly over night it stopped and its stuck now in a join accept loop.
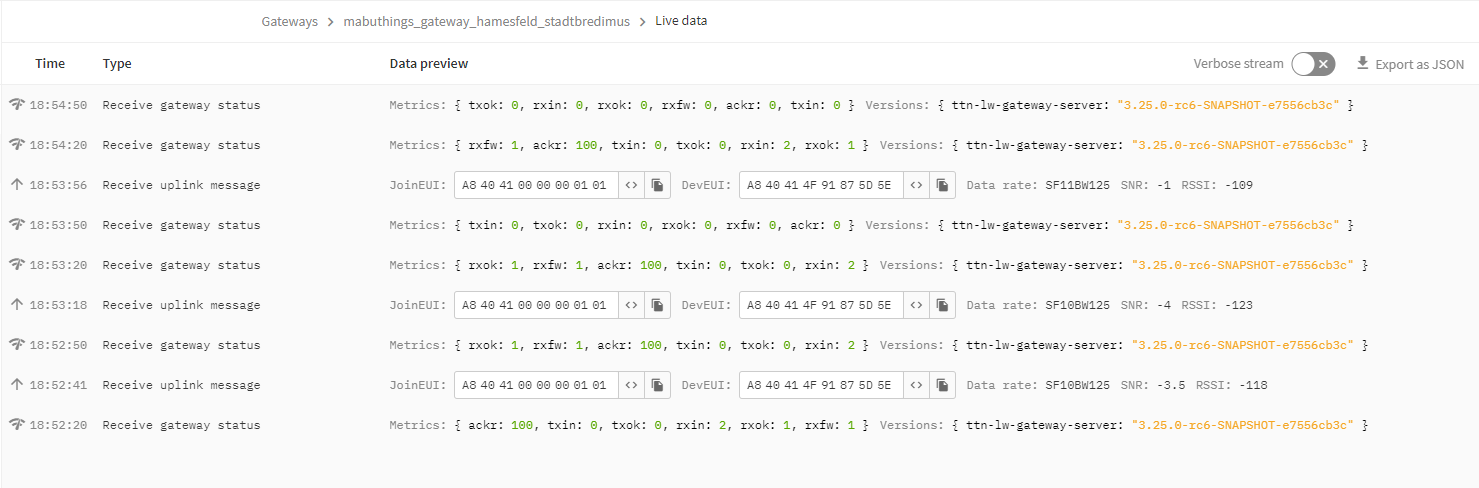
here to screenhots. one from the gateway and one from the sensor:
and this antenna / gateway eui-a84041ffff21b5a4 also gets the join-request, and this gateway is working because i keep getting payloads from other devices threw this antenna.
Not necessarily - the message says that it failed to schedule with that EUI - it could be another gateway in your area that has downlink capacity or heard the join request. LoRaWAN is too complicated to start making assumptions or guessing - it would be like a million monkeys trying to write the specification on a typewriter, very unlikely to hit on the correct combination of keypresses.
An antenna is the (typically black) stick that sends out radio waves. The gateway is the box that it’s attached to that then has the Ethernet/WiFi that connects to TTN. The LoRaWAN Network Server won’t know if the antenna is not connected. What it is saying is that there is no time left to schedule the downlink.
Something strange is happening either with the gateway or it’s network connection. What have you tried in the way of reboots/restarts? Do you have other devices you can check are working OK. Have you changed any settings for the gateway or the device?
How is you node (WSC1-L) configured? What Freq plan settings? should be on RX2 SF9 (Recommended for TTN) at both node and GW (you need to use the drop down menu not just accest 1st you see listed!) - I see you have GW set for SF12. I dont see any commentary for RX2 window in messages and clearly RX1 window is exceeded - too much backhaul latency? or device configured with too short RX1 (& RX2) window. When 1st set up you might have got lucky but new attempts to join subsequently have failed. Was it initially in the lab/on the bench or a test set up and now in the field/relocated?